US: Core PPI and Import Prices Reinforce Cost Pressures

Download File
Reading time: 2 minutes
Tempo de leitura: 2 minutos
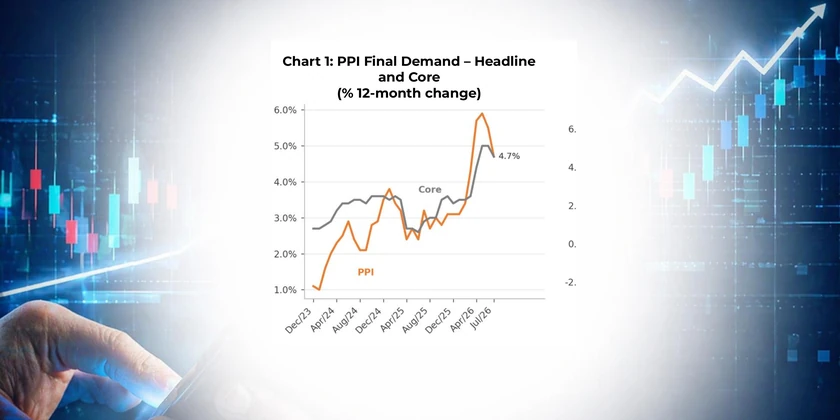
  • The Producer Price Index (PPI) for final demand was flat in July (0.0% on the month, seasonally adjusted) and is up 4.7% over 12 months. The core index — which excludes foods, energy and trade services — rose 0.4% on the month and also 4.7% over 12 months (Chart 1).
  • Both measures have eased from their recent peak (close to 6% in mid-2026), but each remains around 4.7% — well above the pace consistent with the 2% target, a sign that cost pressure at the wholesale level persists (Chart 1).
  • On the month, final demand goods fell 0.7%, with gasoline down 5.7% and truck freight 1.8%. On the services side (+0.2%), the main upward driver was portfolio management (+6.5%), a volatile item tied to financial market performance.
  • Import prices fell 0.4% in July (after -0.3% in June) but are up 5.9% over 12 months. The monthly decline came from fuel (-7.2%, the largest since May 2025; +25.2% over 12 months); excluding fuel, import prices rose 0.4% on the month and are accelerating to 4.5% over 12 months, suggesting persistent pressure from tariff policy (See Chart 2).
  • The divergence is telling: while oil drags the headline indexes down in the short term, the core measures — both the PPI core and import prices ex fuel — remain firm.
  • For monetary policy, the picture is ambiguous: the well-behaved headline PPI offers some comfort, but the stickiness of the producer and import cores suggests that part of the disinflation still depends on a truce in energy prices — a relief that could reverse. The Fed should stay attentive to this pass-through before accelerating rate cuts.

Leave a Reply

Your email address will not be published. Required fields are marked *

The hidden game of the market that few dare to expose.

Discover how influence and manipulation shape decisions every day — and learn to see what most overlook.

Newsletter Market Cruncher

Get strategic market insights delivered straight to your inbox.

Stay Informed

Related Articles

US: Resilient Productivity and Contained Labor Costs Support Disinflation

Nonfarm business labor productivity (output per hour) rose 1.4% at an annualized rate in the second quarter of 2026 and 2.2% from the same quarter a year earlier (See Chart 2). The result combines a 1.7% increase in output with a mere 0.3% rise in hours worked.

A Prosperous Future Will Have to Wait

For the third consecutive election, Brazil is once again debating two competing visions for the country that, at their core, have been familiar since 2018. On one side, the Workers’ Party (PT) continues to see the state as a key driver of economic development. On the other, the Bolsonaro camp advocates a smaller state and a greater role for the private sector. The slogans and circumstances change, but the core of the debate remains largely the same.

Hyperscalers: How Much Is Too Much?

Just 10 of the most relevant companies among the so-called hyperscalers in the United States are set to invest close to a total of USD 1 trillion in 2026, up from a mere USD 100 billion in 2020 (chart 1).

Newsletter Market Cruncher

Receive strategic market insights directly to your email.

Market Cruncher uses your contact information to send you relevant content.
You can unsubscribe at any time.