| Hyperscalers: How Much Is Too Much? |
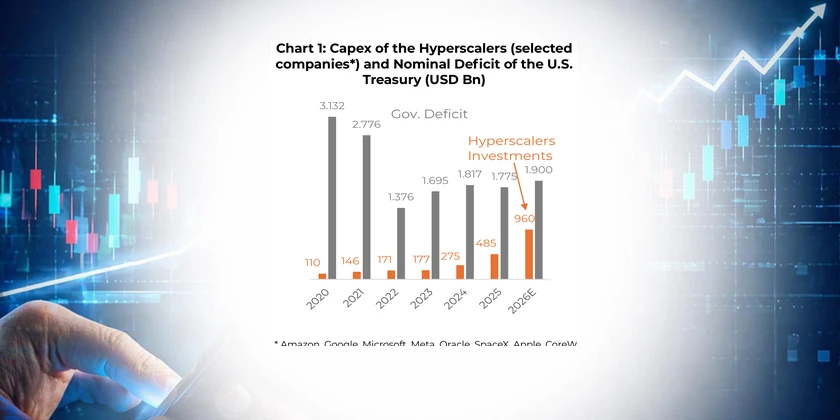
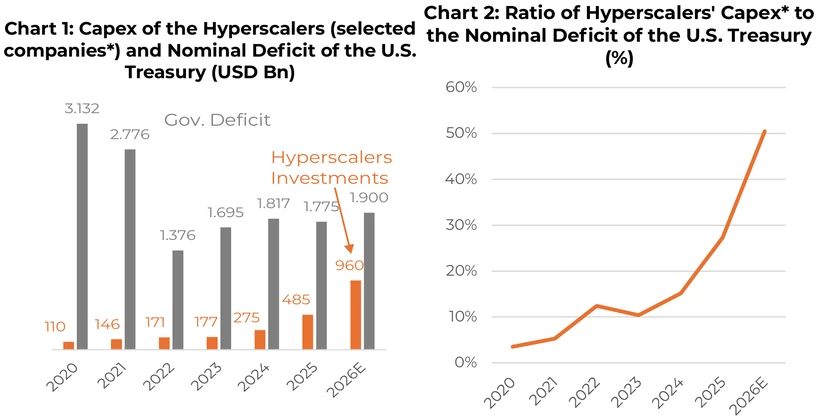
| Just 10 of the most relevant companies among the so-called hyperscalers in the United States are set to invest close to a total of USD 1 trillion in 2026, up from a mere USD 100 billion in 2020 (chart 1). – The Capex associated with the AI boom is competing for investors’ attention and is helping to put pressure on U.S. Treasury yields. To give a sense of magnitude, the ratio of Capex (of our sample) to the federal government’s financing needs jumps from 3% to 50% in 6 years (chart 2). – Higher interest rates neither stem from a greater perception of risk nor are they causing a flight to safety. The market perceives a movement of healthy competition for resources that finances the expansion of productive capacity and will ultimately produce significant productivity gains in the coming years. |
Introduction — A Shift in the Balance of the Capital Markets
The rise in long-term interest rates in developed economies reflects a broader shift in the balance between the supply of and demand for assets. In the U.S., three forces are combining: persistently high fiscal deficits, a reduction by global investors of their exposure to Treasury securities, and an extraordinary expansion of investment in infrastructure related to the artificial intelligence boom.
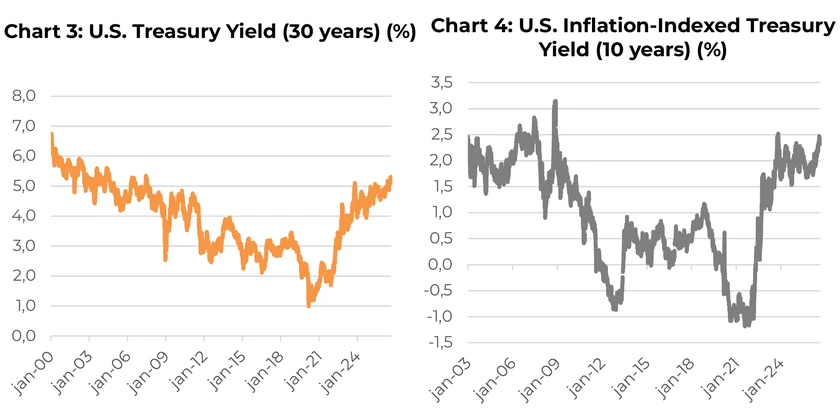
The Treasury 30-year reached 5.34% on August 18, the highest level since 2007. The Treasury’s own reaction, with the unexpected expansion of long-dated bond buybacks, the so-called Treasury Twist, is a sign that the rise in financing costs has ceased to be merely a market fluctuation and has come to occupy a relevant place in public debt management.
Long-Term Rates Are Rising
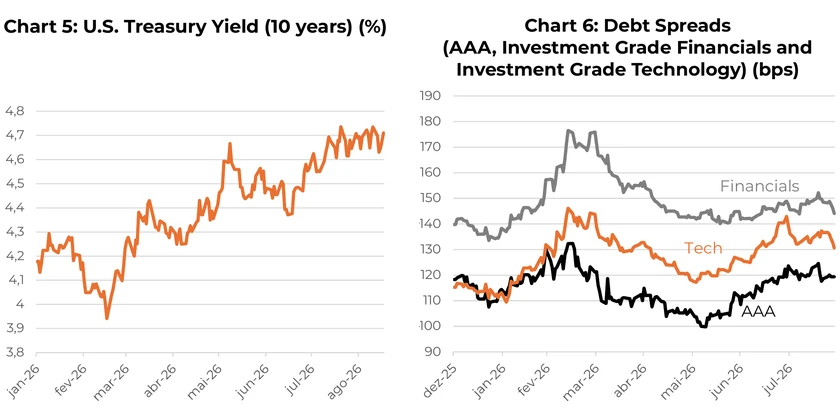
The pressure on U.S. Treasury yields (chart 3) is associated neither with monetary policy nor with inflation expectations. We have already discussed this topic in Global Yields Repricing. The yields of TIPS are also at elevated levels by historical standards (chart 4). There are at least three structural components behind this movement. The first is fiscal. The federal deficit remains close to 6% of GDP even with the economy operating near full employment. The deficit was US$ 1.78 trillion in fiscal year 2025 and is expected to reach US$ 1.9 trillion in 2026.
The second component is on the demand side for government securities. The period in which central banks and official investors acted as relatively stable buyers of U.S. duration appears to be behind us. The Treasuries held in custody at the Federal Reserve by foreign official institutions fell from about US$ 2.87 trillion at the end of 2024 to US$ 2.67 trillion in May 2026. At the same time, surveys of managers show greater interest in gold and diversification.
The third component, and the focus of this text, is the emergence of an enormous-scale private competitor for the same global pool of savings: the artificial intelligence infrastructure complex. Hyperscalers, neoclouds and associated companies have begun building data centers, acquiring servers and GPUs (Graphics Processing Units) and contracting power capacity in volumes that a few years ago would have been macroeconomically small, but today are no longer so.
The phenomenon is global. The United Kingdom and Japan have already altered their debt issuance profile in the face of weakening demand for long-dated securities. In Germany and other European markets, sovereign yields have also undergone a strong repricing. Larger, more indebted governments with growing financing needs are encountering a supply of savings that has not grown at the same pace.
The AI Boom
The change in the scale of AI investment is the central point. We take as a reference a sample of 10 of the most relevant companies among the so-called hyperscalers in the United States: Amazon, Google, Microsoft, Meta, Oracle, SpaceX, Apple, CoreWave, Micron and Nvidia. The combined Capex of these companies, which was no more than USD 110 billion in 2020, is expected to reach about USD 960 billion in 2026, an increase of USD 850 billion over the period.
To put the order of magnitude in perspective, we use the nominal deficit of the U.S. federal government as a simple proxy for its annual financing need. The deficit fell from the exceptional pandemic level of
US$ 3.1 trillion in 2020, but remained in the range of US$ 1.8 trillion in recent years. In other words, the Capex of our sample of companies tied to the AI boom went from 3% of the deficit in 2020 to approximately 27% in 2025 and about 50% of the Treasury’s projected negative balance for 2026.
The comparison requires an important caveat. Capex is not synonymous with raising funds in the financial market. Amazon, Microsoft, Alphabet and Meta still generate very high operating cash flows and can finance a significant part of the investment internally. In addition, leases, supplier financing, projectfinance and off-balance-sheet structures change the way the demand for capital reaches the market. Capex should therefore be interpreted as an indicator of the total absorption of economic resources, and not as a direct measure of securities issuance competing with Treasury paper.
Even with this caveat, there is already evidence of transmission to credit. Market data already show annual debt issuance by the technology sector above US$ 300 billion in 2025 and 2026. Indeed, the hyperscalers have been increasing their share of the investment grade indices and experiencing wider spreads. Chart 6 shows how the cost for technology companies has risen relatively more than that of triple A companies or of investment grade companies in the financial sector, for example.
The investment shock, therefore, is beginning to move beyond being merely an internal allocation decision by companies and is now explicitly competing for financing capacity in the market.
Risk Aversion Relatively Stable
The distinction between the causes of the rise in rates is essential. An increase in yields driven by a deterioration in the perception of sovereign solvency or by a generalized rise in risk aversion would have quite different implications from an increase that stems from greater demand for resources for productive investment.
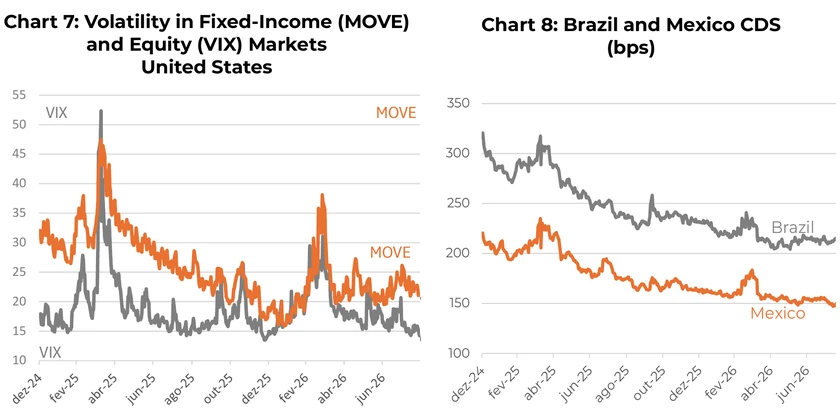
The interpretation that seems most compatible with the current signals is an intermediate one. The public deficit is an important part of the pressure on rates, and the reduction in the so-called convenience yield of Treasuries suggests that the U.S. government no longer obtains the same safety premium as before. But there are, so far, no signs equivalent to a crisis of confidence. The volatility of equities and fixed-income assets remain well below the levels observed in classic episodes of systemic stress (Chart 7), and the sovereign spreads of several emerging markets remain relatively well behaved (Chart 8).
In this sense, part of the rise in real rates can be seen a consequence of a competition for resources that, although it raises the cost of capital in the present, finances the expansion of productive capacity. Investment in data centers, semiconductors, networks, power generation and digital infrastructure create assets and, if the technology delivers the expected gains, can raise productivity, profits and future wealth. This is economically distinct from a rise in rates caused exclusively by larger public deficits, when the marginal use of resources tends to produce a less direct future economic return.
Naturally, this reading depends on the AI boom not being merely an investment bubble. The available data does not yet settle this discussion, but there are concrete signs of final demand. AWS’s backlog, for example, grew 154% over twelve months. Annualized revenue specifically tied to AI already exceeds US$ 37 billion at Microsoft and US$ 25 billion at AWS. Token consumption is also growing rapidly. In short, the investment appears to be accompanied by orders, demand and revenue.
Risks
There is an important danger in the current market dynamics. A structurally higher risk-free rate raises the hurdle rate of every investment project and reduces the present value of future cash flows. Even if AI investment is productive, its financing (and the financing of other projects in the economy) becomes progressively more expensive as it competes with a Treasury that also needs to raise large volumes.
The most relevant risk for the coming quarters, however, is still that of an AI bubble taking shape. One cannot rule out a scenario in which the exuberance in terms of stock valuations and investment in the sector proves incompatible with the returns actually delivered by the projects, exposing a discrepancy between expectations and reality.
Conclusion
The discussion about the rise in long-term U.S. interest rates should not be reduced to a single explanation. The fiscal picture is clearly relevant, and structural demand for Treasuries has become less stable. But there is a third force that has taken on macroeconomic dimensions in a very short time: the explosion of investment in artificial intelligence.
The most likely consequence is a world in which the equilibrium price of capital is higher than that observed in the previous decade. The interpretation, however, need not necessarily be negative. If a significant part of this pressure on rates is associated with private investment capable of raising productivity and future income, the rise in real rates is also the price of an economy with more investment opportunities. The point to watch will be to identify when this healthy competition for resources begins to produce excess leverage, compression of returns, or a generalized widening of spreads.