Summary and Conclusions
GDP grew 0.48% in Q2 2026. Household consumption and gross fixed capital formation decelerate over the quarter and over the four-quarter accumulation, while government consumption and exports accelerate.
The demand outlook is conditioned on: 1) Employment, which decelerated from 2.44% to 0.72% over twelve months; 2) Credit extended to households, which decelerated but remains positive in a context of high indebtedness; 3) high income commitment to debt service, at 28.5%, a record for the series.
- The IBGE released, on 09/02/2026, the Quarterly National Accounts results for Q2 2026. GDP grew 0.48% over the previous quarter, in the seasonally adjusted series; over the four-quarter accumulation, growth was 1.87%.
- Assigning probabilities to monetary policy scenarios depends less on the aggregate growth rate and more on its composition: which component is decelerating, the economic environment of those who produce, and the conditions of installed capacity in the country.
- In this edition, we address the demand side. The second article will cover the supply side and sectoral aspects. The third and final one will discuss potential implications for the interest rate.
The Slowdown
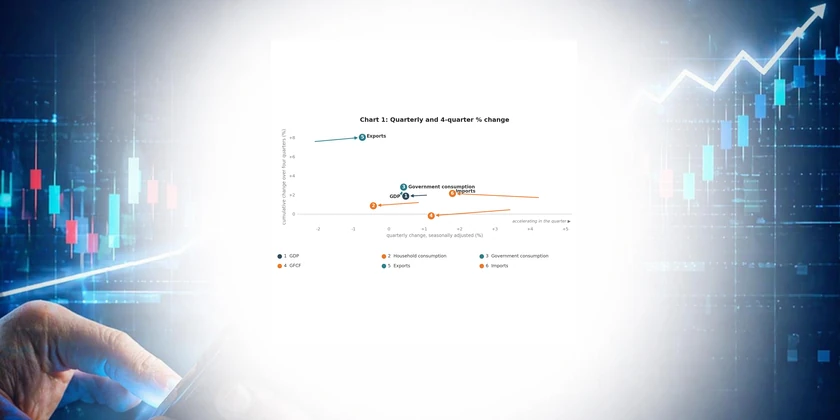
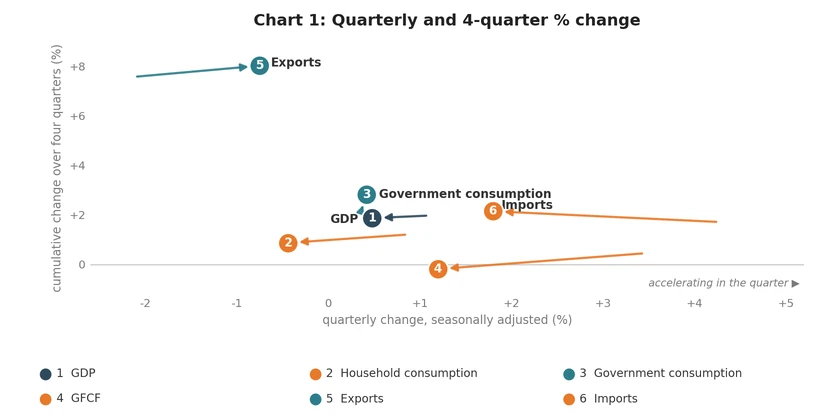
We will call an unequivocal slowdown the situation in which the seasonally adjusted quarterly change and the four-quarter cumulative change are, simultaneously, lower than in the previous quarter (Chart 1).
GDP advanced 0.48% in Q2 2026 in the quarterly comparison, after expanding 1.07% in Q1 2026. Over four quarters, the pace moved from 1.97% to 1.87%.
On the demand side, household consumption decelerated on both readings: from 0.84% to −0.44% in the quarterly comparison and from 1.20% to 0.87% over four quarters. Gross fixed capital formation (GFCF) did too: from 3.43% to 1.20% in the quarter and from 0.44% to −0.19% over the accumulation. They represent the private sector.
Two components accelerated on both readings: government consumption and exports. Exports deserve a careful reading of the chart: they registered −0.75% in the quarter, but had come from −2.09%; over the accumulation, the 8.04% expansion is the strongest of all components.
Government consumption moved from 0.37% to 0.42% at the margin and from 2.28% to 2.82% over four quarters. Although the swing is modest, it somewhat limits disinflation.
Imports are the ambiguous case, with a strong deceleration in the quarter (from 4.24% to 1.80%) and a rise over the accumulation (from 1.72% to 2.15%). At the margin, this is consistent with the slowdown in private consumption and investment.
Thus, the slowdown appears disinflationary, despite the resilience of government consumption.
Three Variables: Employment, Credit Extension, and Income Commitment
Three drivers suggest that the deceleration trend in private-sector demand may continue.
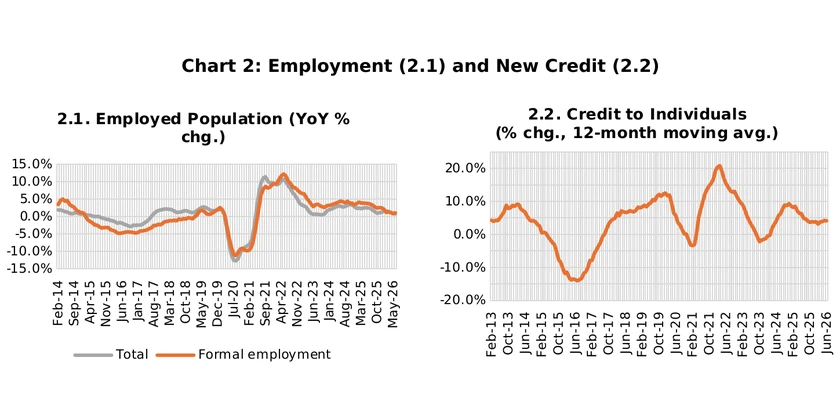
The employed population, which was growing 2.44% over twelve months through Jun25, slowed to 0.72% in Jun26. Formal (registered) employment followed the move, going from 3.73% to 1.02%. The slowdown in employment, if it persists, will translate into further weakening of consumption ahead.
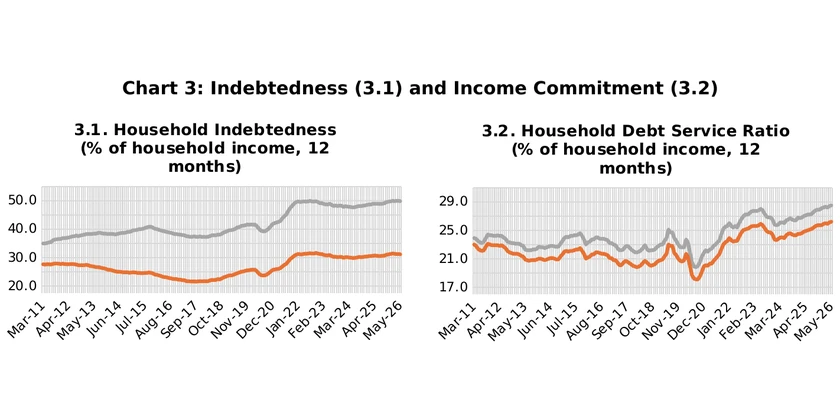
Credit extended to households grew 4.12% above inflation over the 12 months through Jun26 relative to the previous twelve months. This also represents a deceleration from the 6.31% of Jun25, but it remains positive and close to the pace of Jun24 (4.10%) (Chart 2.2). This continued advance of credit has affected households’ income commitment to debt service, which stood at 28.5% in May26, the highest level in the historical series, begun in 2011. Excluding housing finance, the 26.2% figure is also a record. Total indebtedness stood at 49.8% of income in May26, practically at the historical peak of 49.9% recorded in Jul22, Mar26, and Apr26 (Chart 3.1).
The combination of the three variables characterizes the current situation, in which new credit flows in a context where a record share of income is committed to servicing contracted debt.
Conclusion
The slowdown in private consumption and investment in Q2 2026 is unequivocal: household consumption and gross fixed capital formation fall on both readings simultaneously. Imports validate the diagnosis at the margin. What sustains the aggregate is public spending and external demand.
Three variables warrant monitoring. On employment, if growth of 0.72% moves toward zero or turns negative, consumption would lose important support (income). Delinquency, though relatively contained, could force a tightening of credit supply.