- The familiar national employment and income statistics for Brazil conceal an enormous dispersion and inequality across regions: states and capitals coexist with very different realities of employment, income, and informality, so that the isolated national rate offers a poorly representative reading of the regional diversity of the Brazilian labor market.
- The strong performance of agribusiness and the mineral extractive industry has sustained job and income generation in specific regions of the country, disproportionately benefiting the states and capitals most exposed to these sectors, while regions less favored by this cycle continue to show weaker labor-market indicators.
- Regional inequality reinforces the importance of income-transfer programs, such as Bolsa Família, precisely in the regions where poverty is greatest.
Introduction
The Brazilian labor market is often described by a single number — the national unemployment rate — but this aggregate indicator conceals an enormous diversity of local situations. States and capitals differ not only in the level of employment and income, but also in the stability of these variables over time, reflecting both their productive structure and the very size of the sample used to measure them by the IBGE.
This report organizes that snapshot by dividing the country’s 27 states and 27 capitals into two equally sized groups, according to the annualized volatility of employment measured by the PNAD Contínua since 2016. Over the next pages, we explore how this volatility relates to informality, unemployment, labor-market size, and income composition, and why this distinction matters both for reading the data and for the reliability of the local statistics themselves.
Informality and Volatility
To better analyze what is happening in the labor market at the regional level, some care with the data is needed. Some states and municipalities tend to show greater variability in quarterly readings, whose cause may be linked both to structural factors and to the size of the sample used by the IBGE. Excessive variability may indicate a greater degree of uncertainty about the robustness of the information.
One of the structural characteristics linked to excessive fluctuations in the numbers is the degree of informality of each geographic area, which appears to be related to more intense swings in the variables that measure labor-market conditions. The relationship is real, but far from mechanical. Among the 13 least volatile states, average informality is 34.7% — well below the 46.7% observed in the most volatile group. Santa Catarina and Paraná, the two states with the lowest variance in the employment data, have low informality (25% and 30%, respectively). Pará, in the middle of the sample in terms of variability, has informality of nearly 56%, the second highest among all states in the country (surpassed only by Maranhão).
A large share of informal workers is concentrated in retail trade, general services, construction, and activities linked to transport and delivery apps — sectors more sensitive to the economic cycle and with more unstable employment ties, which can naturally end up raising the degree of oscillation in the estimates.
The methodology of the survey conducted by the IBGE also makes a difference: the smaller the sample, the greater the volatility of the data tends to be in a state, and especially in municipalities. This component of the variance does not necessarily reflect real instability in the labor market, but rather a statistical effect that ends up bringing a larger margin of error to the estimates.
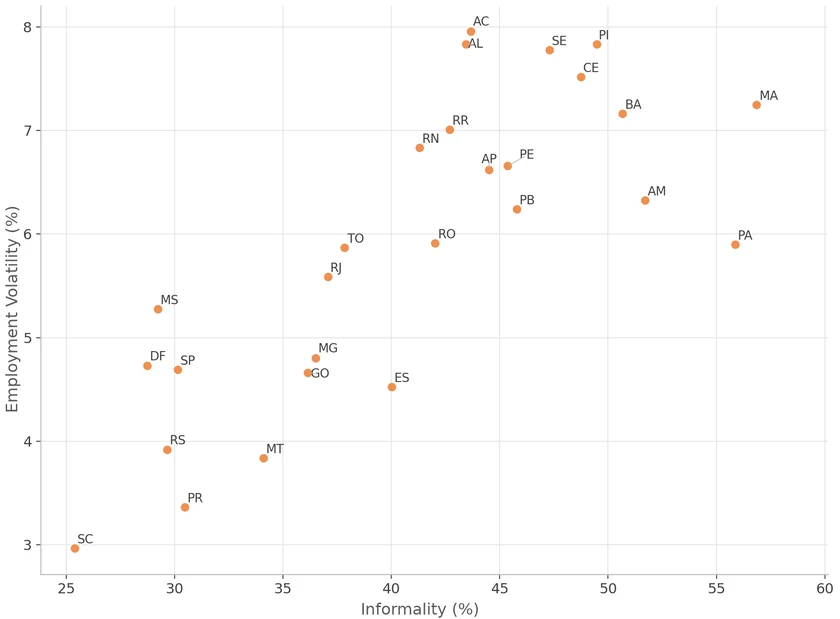
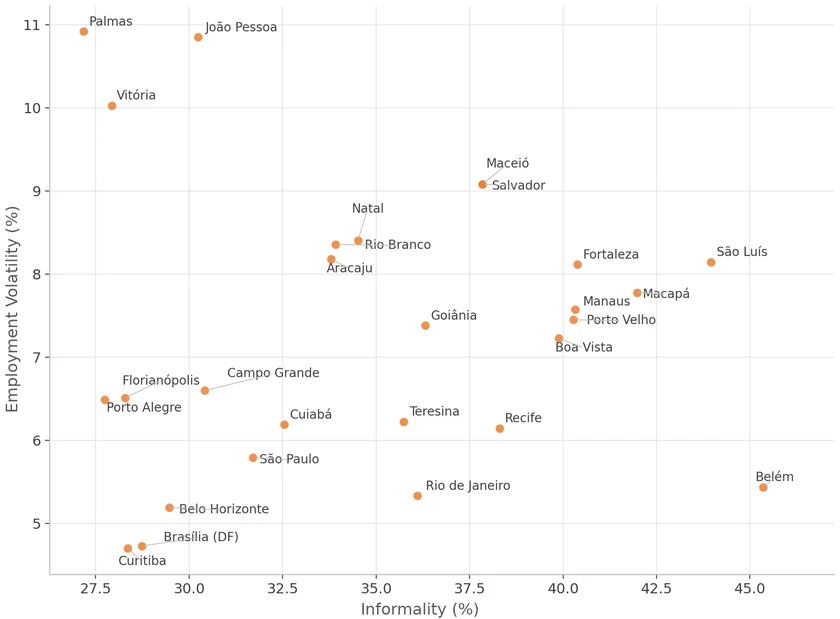
The same exercise, replicated for the country’s 27 capitals, shows a pattern similar to that of the states, but with much smaller dispersion, since capitals usually display a greater degree of economic sophistication and diversification than the interior of their respective states.
The cities of São Paulo and Rio de Janeiro are among the 5 with the lowest data volatility, even though their degree of informality is not very different from the national average. This reinforces the reading that the absolute size of the labor market, and not just the degree of formalization, acts as a stabilizer of the series: the larger and more diversified a capital’s base of employed workers, the smaller the percentage swing from one quarter to the next tends to be, even when a relevant part of that base is informal.
The capitals of the North and Northeast stand out in terms of informality. They tend to present structural difficulties linked to accelerated urbanization, insufficient productive investment, and, consequently, a low capacity to absorb formal labor.
Unemployment Rates
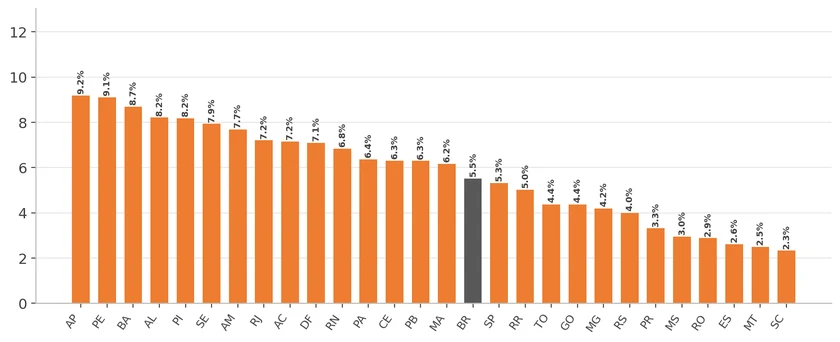
The unemployment rate, measured by the moving average of the last four quarters through the second quarter of 2026, varies markedly across states. Santa Catarina (2.3%), Mato Grosso (2.5%), and Espírito Santo (2.6%) show extremely low rates, while Rio de Janeiro (7.2%) and the Federal District (7.1%) show that low volatility is not synonymous with high employment.
The differences are strongly linked to the economic activities predominant in each state vis-à-vis the current cycle. The South region is expected to lead regional growth in 2026, driven by the recovery of Rio Grande do Sul’s agribusiness, while the Center-West also benefits from the strong performance of soybeans and livestock. These sectors, besides generating direct rural employment, spread income to trade and services in the region’s capitals. Meanwhile, higher unemployment in states such as Amazonas reflects a more concentrated and less diversified economic base than that of the southern states.
Bahia (8.7%), Alagoas (8.2%), Pernambuco (9.1%), and Amapá (9.2%) are among the worst performers in terms of employment of their residents. These states face structural difficulties that mutually reinforce one another: without enough formal job creation, the population migrates to informal activities or remains in search of work, raising both the unemployment rate and informality. The weight of Bolsa Família is also relevant in this equation.
It is worth reiterating that states with more volatile indicators tend to present less reliable unemployment estimates. This does not invalidate the medium-term trend, but it recommends caution in interpreting one-off swings of a single quarter in the more volatile states, which may reflect either statistical noise or an actual change in local labor-market conditions.
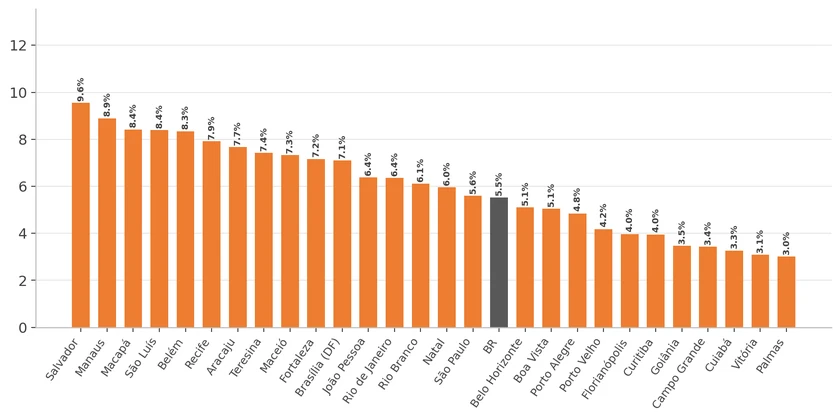
As would be expected, the pattern in the capitals reproduces that observed in the states, but with nuances of their own to urban economies. Cuiabá (3.3%), Campo Grande (3.4%), and Palmas (3%) have the lowest unemployment levels, benefiting from the same favorable agribusiness cycle that drives their states. Belém, Macapá, Manaus, and Salvador show high unemployment (above 8%). In these capitals of the North and Northeast, the weight of the public sector in formal job creation is greater than in capitals of the South and Southeast, which tends to reduce employment volatility (public employment suffers less from private-sector hiring and firing cycles), but does not, by itself, solve the structural problem of low absorption of labor by the formal private sector.
These results reinforce a point already discussed for the states: the weight of income-transfer programs such as Bolsa Família helps to cushion the social impact of unemployment in the most affected capitals, but should not be confused with formal job creation. The income category that includes Bolsa Família and the BPC reached the highest value in the historical series in 2023, contributing to reduce income inequality mainly in the North and Northeast regions — a relevant redistributive effect, but one that acts on households’ disposable income, not on the unemployment rate itself, which continues to reflect, above all, each local economy’s capacity to generate jobs.
It is worth noting that the unemployment rate may be underestimating the real fragility of the labor market in these capitals. A study from the IBRE Blog shows that, in the fourth quarter of 2025, while Brazil’s unemployment rate was 5.1%, the composite labor-underutilization rate in the Northeast reached 13.4% (more than double), when including the underemployed by insufficient hours, the potential labor force, and discouraged workers. This gap also helps explain why the volatility measured in Northeastern capitals tends to be higher: the boundary between employment, underemployment, and unemployment is, in these economies, more fluid and more sensitive to seasonal and cyclical variations.
The Size of the Markets
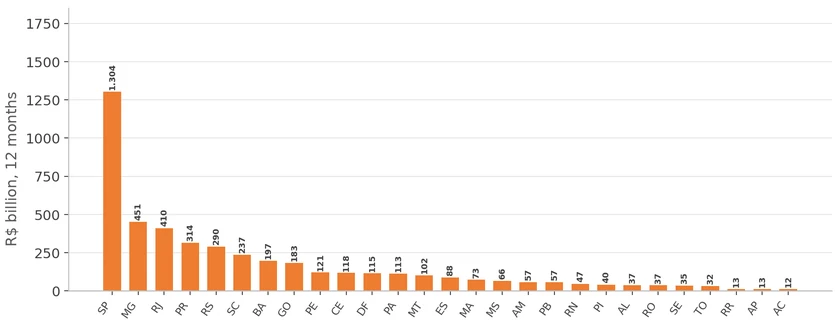
The state of São Paulo alone generates about R$ 1.3 trillion in annual wage bill, more than triple that of Minas Gerais (R$ 451 billion), the group’s runner-up. Adding São Paulo, Minas Gerais, and Rio Grande do Sul, the total exceeds R$ 2 trillion per year. It is no surprise that the states with the largest wage bill are precisely the most diversified and industrialized, with labor markets large enough to absorb localized sectoral shocks without this translating into large swings in the aggregate labor-market series. A negative shock in a specific sector — for example, a poor harvest or a one-off crisis in the automotive industry — has a proportionally smaller impact on total employment in São Paulo than it would in a state whose economy depends on few sectors.
Bahia stands out as an interesting case: despite belonging to the group with more volatile data, its wage bill (R$ 197 billion per year) is, by far, the largest within this specific sample. This suggests that the volatility of the data in Bahia is more linked to structural factors of the state labor market itself — high informality and strong dependence on lower-productivity trade and services, themes already discussed in the preceding pages — than to a limitation of the size or diversification of its economy.
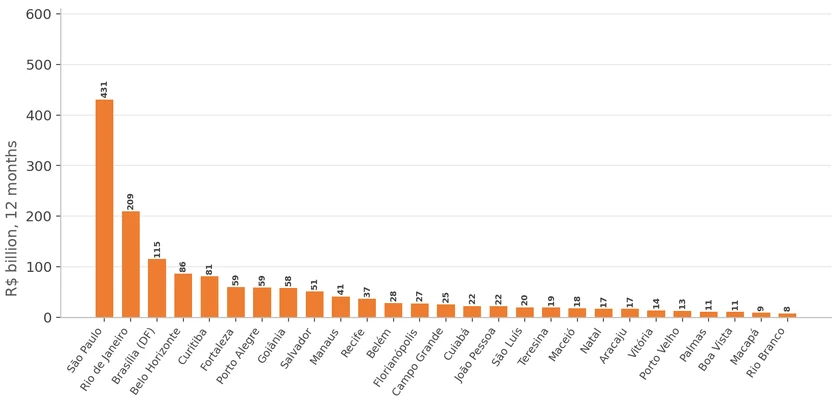
Among the capitals, the concentration pattern is even more pronounced. The city of São Paulo leads with R$ 431 billion per year in wage bill, more than double that of Rio de Janeiro (R$ 209 billion), the runner-up, followed by Brasília (R$ 115 billion) and Belo Horizonte (R$ 86 billion). Belém, Macapá, São Luís, Cuiabá, Porto Alegre, Porto Velho, Florianópolis, Campo Grande, and Manaus have substantially smaller wage bills, all below R$ 60 billion per year.
Income and Inequality
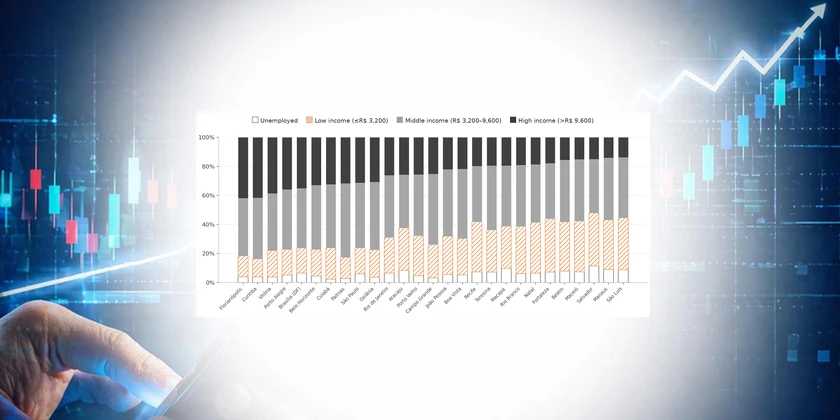
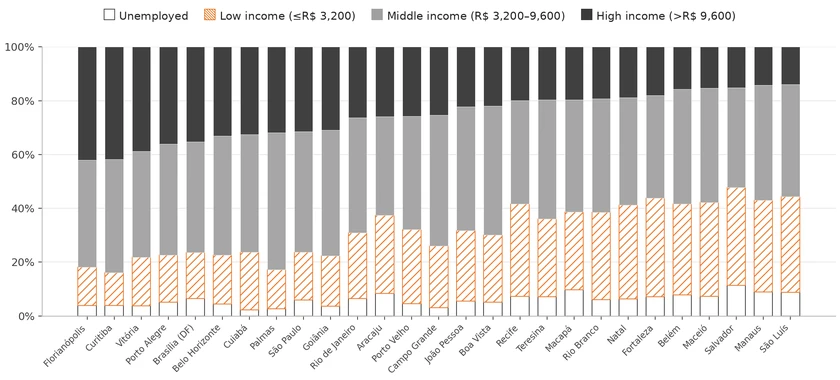
The composition of the labor force by status and income bracket reveals a striking difference. On average, in states with more diversified economies, the share of workers with high income (above R$ 9,600 per month) reaches 21.6% of the labor force, and unemployment is only 4.1%. In the group of states below the national average, the highest income is the privilege of only 12.3% of the workforce and unemployment rises to 6.9%. The most striking figure, however, is that the share of low-income individuals (up to R$ 3,200) goes from 24.7% of the labor force among the former to 42.2% for the latter — almost half of the economically active population.
Once again, this composition is found to be directly linked to informality and productive structure, a theme already discussed in the preceding pages: in states with a greater weight of trade, low-productivity services, and informal work, a larger slice of the labor force is positioned in the lower income brackets. And not only because they earn little, but because, in many cases, they are not even employed. Unemployment alone already explains much of the difference between the groups: in the seven states with the highest unemployment, all in the Northeast, more than 7% of the labor force is looking for a job without finding one.
From a public-policy standpoint, this portrait reinforces the importance of income-transfer programs such as Bolsa Família precisely in the states where the low-income and unemployment share is greatest.
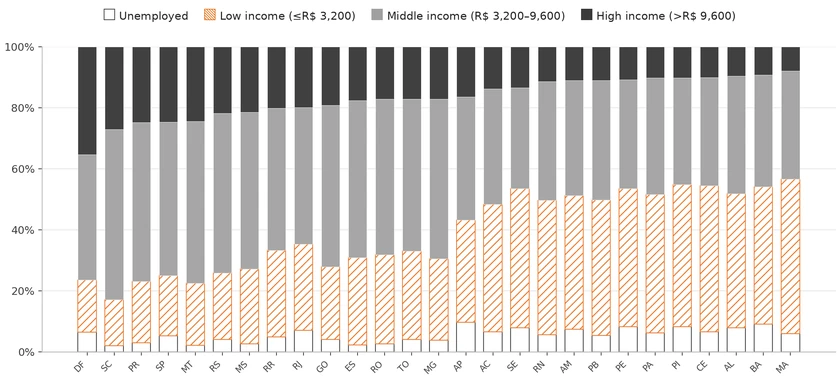
Among the capitals, the composition of the labor force follows a similar pattern. Florianópolis and Curitiba lead in the size of the high-income slice among capitals (42.0% and 41.7%, respectively), with unemployment below 4% (the two best combined portraits of labor-force composition in this report). Salvador stands out with the highest unemployment among all capitals (11.4%) and only 15.2% high income, while São Luís has almost 9% unemployed and 35.5% in low income. Even so, even in the most fragile capitals, the middle-income slice remains relevant (above 35% in all cases), suggesting that urban centers concentrate a broader base of formal and semi-formal jobs than that observed in the interior of their respective states.
Data and Sources Notes
IBGE, Continuous National Household Sample Survey (PNAD Contínua) — quarterly microdata from 2016 Q1 to 2026 Q2, for the 27 states (26 federative units + the Federal District) and the country’s 27 capitals. Agência Gov/IBGE — special study on the impact of Bolsa Família on reducing regional inequality. IBRE Blog (FGV) — structural economic portraits of the North and Northeast regions, and a study on labor-force underutilization in the Northeast. Banco do Brasil, Resenha Regional — regional growth projections for 2026. Revista Nordeste — reports on unemployment, informality, and productive structure in the Northeastern states. World Bank — study on Bolsa Família and the labor market.
Methodological note: the annualized volatility of employment and income is calculated as the standard deviation of quarterly log changes, multiplied by √4, for the 2016 Q1–2026 Q2 series. The split into the 50% least volatile and 50% most volatile groups considers the total employment volatility of each locality. The unemployment reported is the moving average of the last four available quarters (through 2026 Q2). The wage bill is presented in R$ billions, accumulated over 12 months, at 2026 real values. The composition of the labor force by status and income bracket (Charts 8 and 9) is based on the total labor force of each locality in the second quarter of 2026 (unemployed + employed by bracket, excluding non-classifiable), divided into unemployed, low income (up to R$ 3,200), middle income (R$ 3,200 to R$ 9,600), and high income (above R$ 9,600) — the income limits follow the same IPCA-adjusted base as the other brackets in the report. The labor household-income brackets follow nominal limits adjusted annually by the IPCA to preserve constant purchasing power.