Summary and Conclusions
Under the same criterion used to assess demand, only three of the twelve sectors decelerate unambiguously (manufacturing, retail trade, and other services). The three are sensitive to household consumption, a demand component that also decelerates unequivocally.
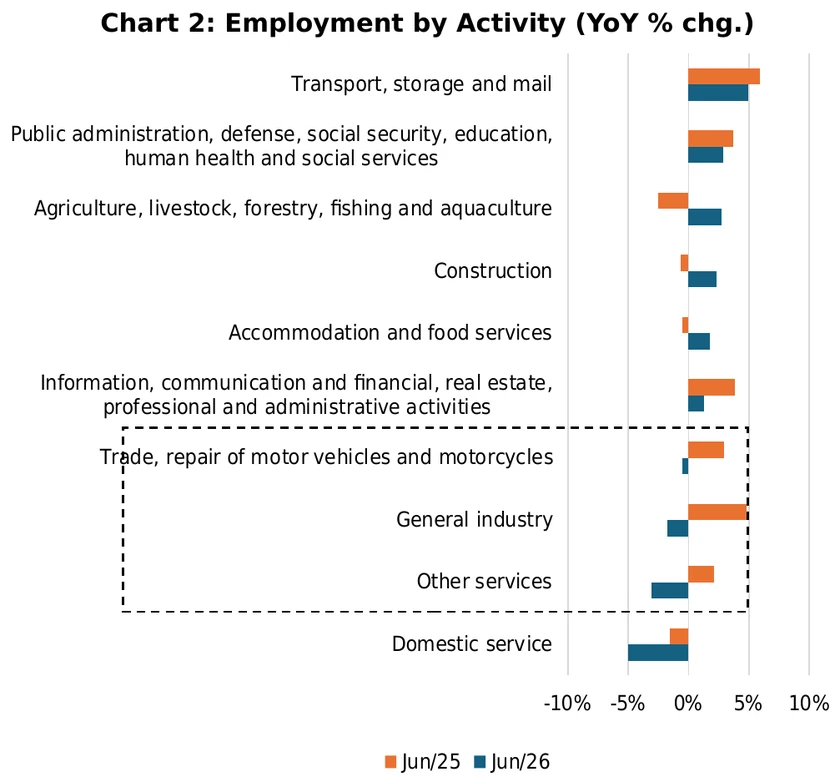
The slowdown in the three is reflected in weakening employment. The YoY change in employment in Jun26 went from +4.85% to −1.75% in industry; other services from +2.12% to −3.09%; and retail trade from +2.97% to −0.50%. The weakening of these activities appears to have reached hiring.
The supply side indicates, by a different route, that the economic slowdown results from the loss of steam in domestic demand and that restrictive monetary policy was effective in bringing about the adjustment in the pace of growth. It also highlights the cost imposed by the model of fiscal incentives to consumption: high indebtedness, both public and private.
In the short term, together with the recent disinflation observed in consumer prices, it suggests room for the continuation of the Selic calibration cycle.
- The Quarterly National Accounts System data showed that GDP grew 0.48% in Q2 2026 over the previous quarter, seasonally adjusted, and 1.88% over the four-quarter accumulation.
- Our reading is that assigning probabilities to monetary policy scenarios depends less on the aggregate growth rate and more on the composition: whether the decelerating sectors are those exposed to the local market and, therefore, more sensitive to monetary policy.
- The first article analyzed demand. In this edition we address the supply side. The third and final one on this theme will discuss the potential implications for the interest rate.
What the Joint Criterion Reveals
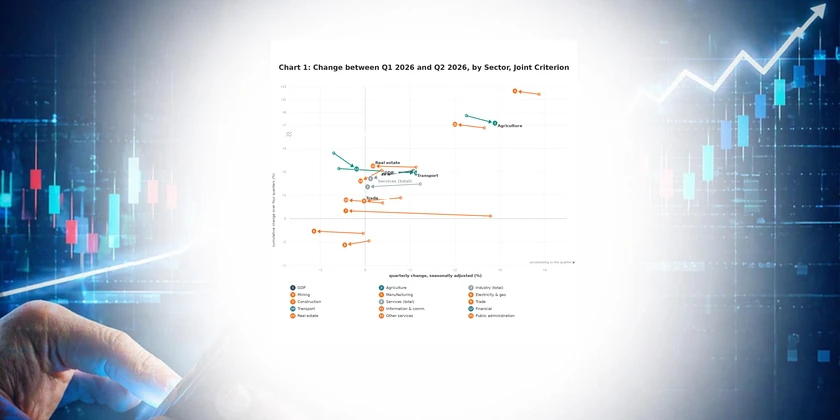
Applying the same rule from the first article to the supply components, a less dramatic picture emerges. Three activities decelerate unambiguously: manufacturing, retail trade, and other services. None accelerates on both readings, i.e., the remaining nine are ambiguous.
Among the ambiguous sectors, construction decelerated from +2.79% to −0.36% in the quarterly change, and showed a modest rise over the accumulation (from +0.13% to +0.31%). The electricity, gas, and sanitation sector decelerated from −0.05% to −1.07% quarterly; over the accumulation, it went from −1.24% to −0.57%.
The agriculture, mining, and information and communication sectors continue to post positive change well above GDP and the other activities on both readings. Agriculture and mining (exposed to external demand) grow, over the accumulation, about four and six and a half times GDP, respectively, while information and communication almost four times.
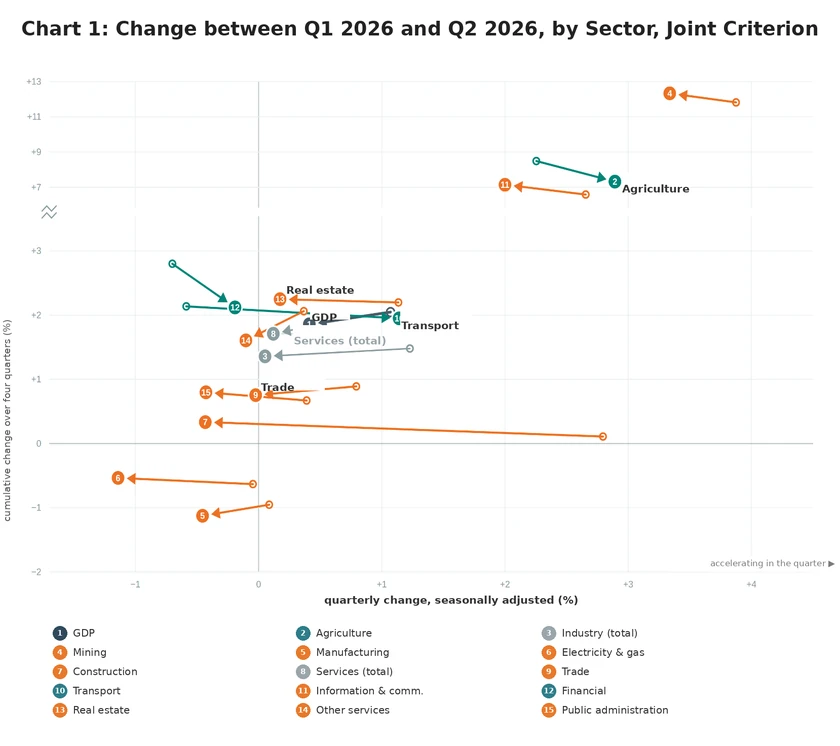
The three supply sectors that reported an unequivocal slowdown are sensitive to household consumption and, to some extent, to private investment—two demand components that also decelerate on both readings. The performance appears to evidence not only the effectiveness of monetary policy in adjusting the pace of domestic demand, but also the exhaustion of the consumption-led model.
The Slowdown Has Also Reached Hiring
Is the weakening of activities associated with domestic demand already affecting hiring? Looking at the PNAD Contínua data, the answer appears to be unequivocal.
Between Jun25 and Jun26, the YoY change in the employed population by activity fell from +4.85% to −1.75% in industry; from +2.12% to −3.09% in other services; and from +2.97% to −0.50% in retail trade (Chart 2). Total employment, over the same period, went from +2.44% to +0.72%.
Three of the four sectors with negative employment change in Jun26 are the same ones showing an unequivocal slowdown in GDP. Activities with ambiguous dynamics continue to hire. It is worth noting that public administration, education, and health grew 2.87% YoY in Jun26, about four times total employment.
Credit and Leverage: How Is Indebtedness?
The Central Bank’s credit statistics suggest that the credit stock decelerated in six of the 12 disaggregated sectors that make up GDP. And the sectors in unequivocal slowdown show a decline or a moderate rise.
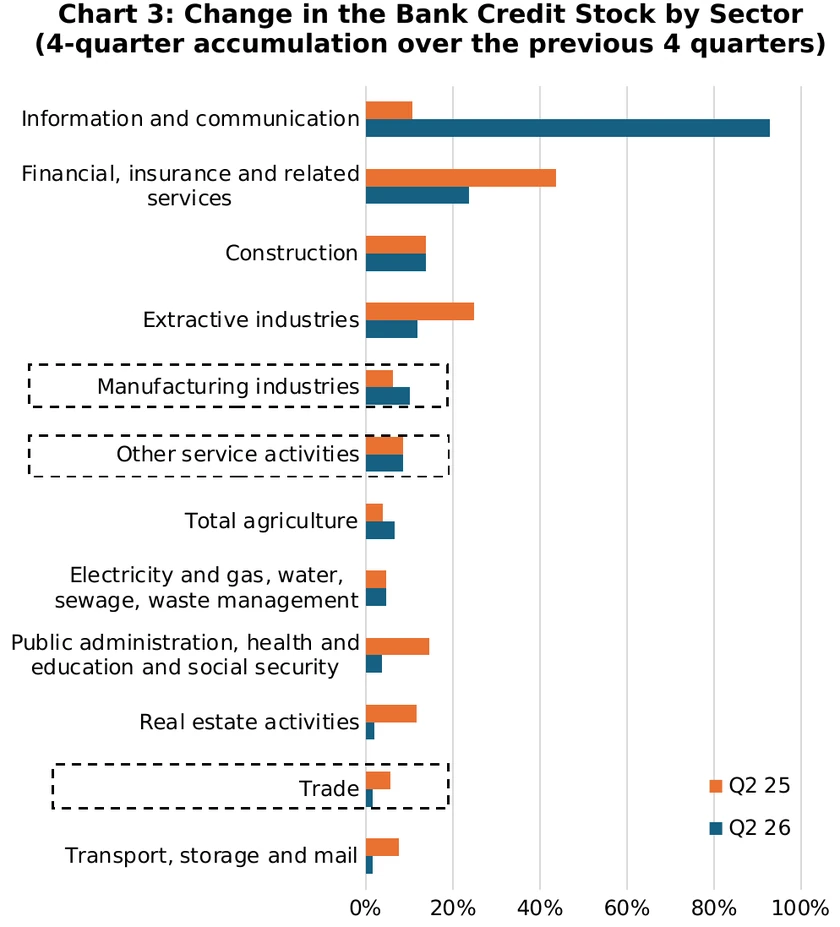
Delinquency in bank credit to micro, small, and medium-sized enterprises is at 5.7%, against 0.7% for large firms. The slowdown in domestic consumption appears to encounter a more fragile situation on companies’ balance sheets, in a way materialized in the growing number of out-of-court and judicial restructuring filings.
Conclusion
Under the same criterion used to assess demand, only three of the twelve sectors decelerate unambiguously (manufacturing, retail trade, and other services). The three are sensitive to household consumption, a demand component that also decelerates unequivocally.
The slowdown in the three is reflected in weakening employment. The YoY change in employment in Jun26 went from +4.85% to −1.75% in industry; other services from +2.12% to −3.09%; and retail trade from +2.97% to −0.50%. The weakening of these activities appears to have reached hiring.
The supply side indicates, by a different route, that the economic slowdown results from the loss of steam in domestic demand and that restrictive monetary policy was effective in bringing about the adjustment in the pace of growth. It also highlights the cost imposed by the model of fiscal incentives to consumption: high indebtedness, both public and private.
In the short term, together with the recent disinflation observed in consumer prices, it suggests room for the continuation of the Selic calibration cycle. Risks remain elevated and will be addressed in the third and final part of this analysis.