Summary and Conclusions
The slowdown in domestic consumption shows that monetary policy has been successful. The cost of the adjustment, however, could have been lower had fiscal policy been aligned.
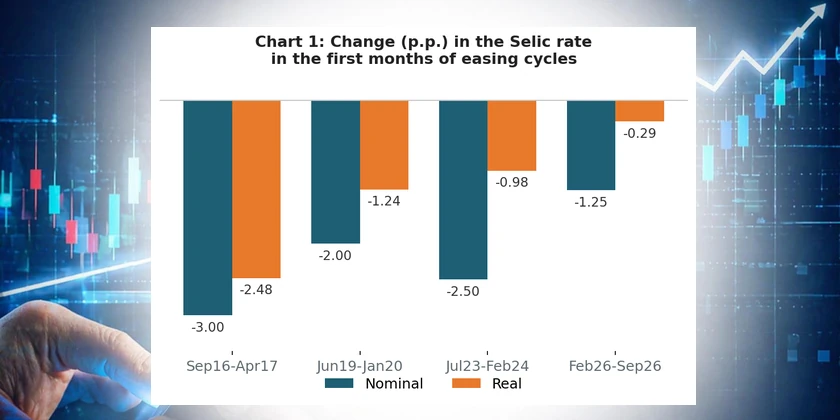
Despite the cuts in the nominal interest rate, the real rate has barely receded. Cuts of 0.25 point per meeting do not ease monetary policy while disinflation advances at the same pace, consistent with the calibration advocated by the BCB.
Services inflation remains high. However, the deceleration in the employment growth rate may reduce pressure on services and consolidate disinflation in prices.
Two risks could compromise this process: the first, and most relevant, is a fiscal policy that once again fuels consumption-led growth. The second is the continuation of the effects stemming from the supply shock.
- The first two editions of the GDP analysis showed that three of the twelve activities are decelerating unequivocally: manufacturing, retail trade, and other services. They also showed that agriculture, mining, and information and communication are growing above GDP, illustrating the asymmetry of growth.
- Our view is that the GDP slowdown will have a floor as long as external demand for commodities and the associated chain sustain expansion of around 8% over four quarters, despite this block representing a small share of the economy. But the slowdown in domestic consumption is significant, even under an expansionary fiscal policy, and allows for the calibration of the Selic rate.
The BCB’s Calibration Keeps the Real Interest Rate Elevated
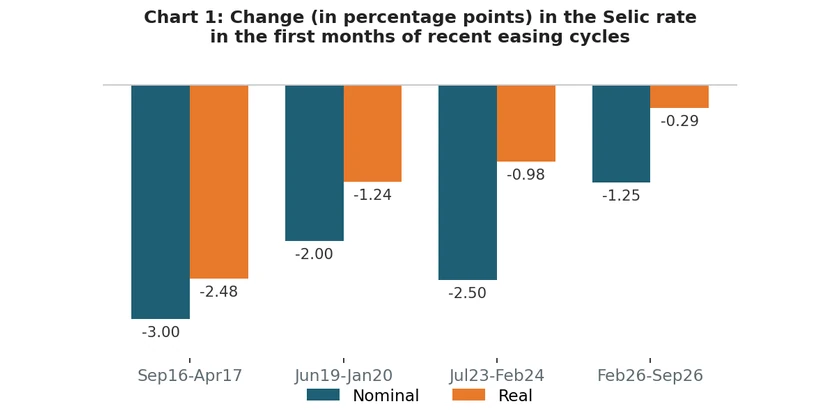
Between Feb26 and Sep26, the Copom cut the Selic rate by 1.25 percentage points (from 15.00% to 13.75%). The real Selic rate fell by 0.29 percentage point (from 8.80% to 8.52%) over this period, meaning the adjustment was almost nil (Chart 1). And it remains well above the average for the Jan04–Aug26 period (6.12%). Thus, the calibration prevents an increase in the real interest rate as disinflation evolves, and our view is that it does not necessarily represent an easing of interest-rate policy.
From Activity to Employment and Services Inflation
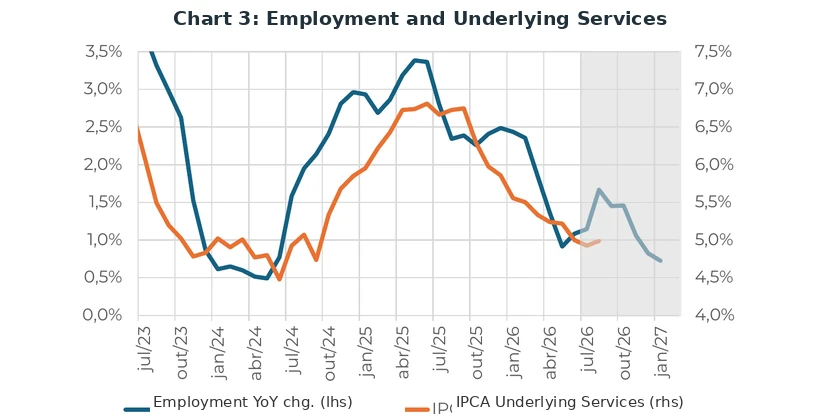
The slowdown in activity appears to have reached the labor market. In the second edition it was observed that, between Jun25 and Jun26, the YoY change in the employed population moved from +4.85% to −1.75% in industry, from +2.12% to −3.09% in other services, and from +2.97% to −0.50% in retail trade. In the aggregate, total employment decelerated from 2.44% to 0.72% between Jun25 and Jun26.
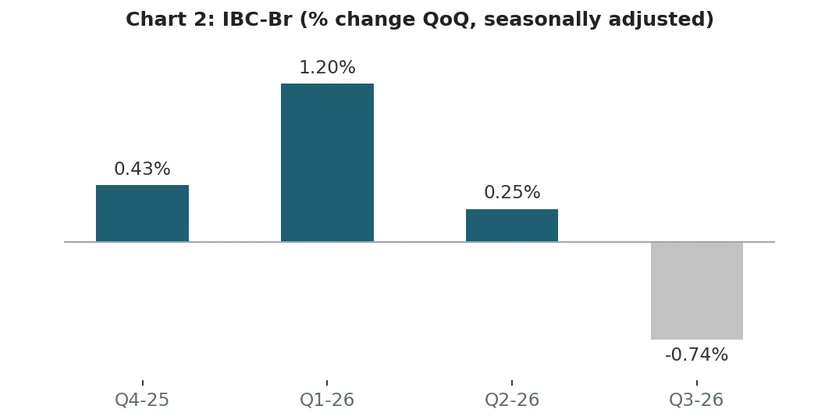
The reading of the most recent data suggests a continuation of the economic slowdown in Q3 2026. The IBC-Br reported a 0.2% MoM decline in Jul26, bringing the quarterly average for the May26–Jul26 period down 0.3% compared with the Feb26–Apr26 period. Moreover, the statistical carryover suggests a 0.7% decline in Q3 2026 (Chart 2) relative to Q2 2026, should the months of Aug26 and Sep26 show zero change in the monthly comparison. And this contraction would be widespread across the three broad sectors (agriculture, industry, and services).
Under this dynamic, the labor market is likely to keep weakening at the margin. The question is whether this weakening will translate into disinflation in services, a component that remains resilient and that causes discomfort for the BCB — flagged as one of the upside risks to inflation. Services inflation over 12 months has already disinflated from 6.17% in Oct25 to 5.46% in Aug26. Underlying services inflation moved from 6.29% to 4.99% over this period.
The lag between employment dynamics and services inflation suggests some probability that underlying services inflation will stabilize below 5% in the coming months (Chart 3).
The relevant risks lie in a fiscal policy that once again stimulates domestic consumption, which could worsen the indebtedness of households and firms and delay deleveraging. In addition, there is the supply shock caused by the war in the Middle East, which may pressure the prices of oil derivatives and other goods affected by the strangulation of the region’s maritime channels.
What This Implies for the Selic
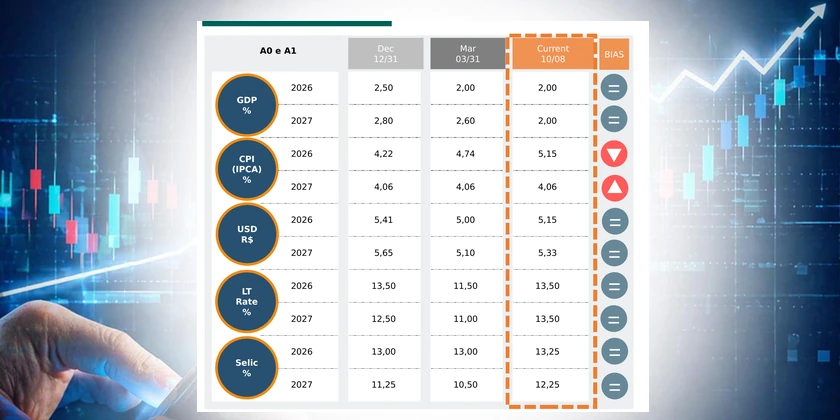
In 2026, two meetings remain: November 3–4 and December 8–9. Pezco Economics projects the Selic rate at 13.25% by the end of 2026, which represents the expectation of two 0.25-percentage-point cuts at both. Our view is that only an interruption of the gradual disinflation under way could lead the Copom to consider a pause. Inflation remains above target and requires a real interest rate above what would be the neutral rate. For 2027, the trajectory will be conditioned on the evolution of the risk factors. The fundamentals (slowdown and disinflation) suggest there is room for the calibration to become, in fact, an effective cycle of interest-rate reductions.
Conclusion
Monetary policy has been producing an economic slowdown and consequent disinflation. The slowdown is concentrated in the sectors sensitive to domestic consumption, which grew 0.54% against 8.44% for the commodities block. The slowdown also appears to have reached employment, reflected in the decline in the growth rate (from 2.44% to 0.72%). This slowdown is expected to reach services inflation, still uncomfortably high. In parallel, the indebtedness of households and firms keeps consumption and investment contained, contributing to the completion of disinflation.
There are still two risks that require monitoring. On one side, fiscal risk, which is associated with the political environment. Maintaining the current fiscal policy will delay the necessary deleveraging and could lead to a credit crisis. The other risk is associated with geopolitical issues and the potential supply shocks that derive from them.
What will determine the trajectory of the Selic rate throughout 2027 is the effect of the evolution of the two risk factors on expectations. On one side, the possibility of concluding the process of slowdown and disinflation, based on responsible fiscal policy. On the other, the risk of ending this cycle in a credit crisis.