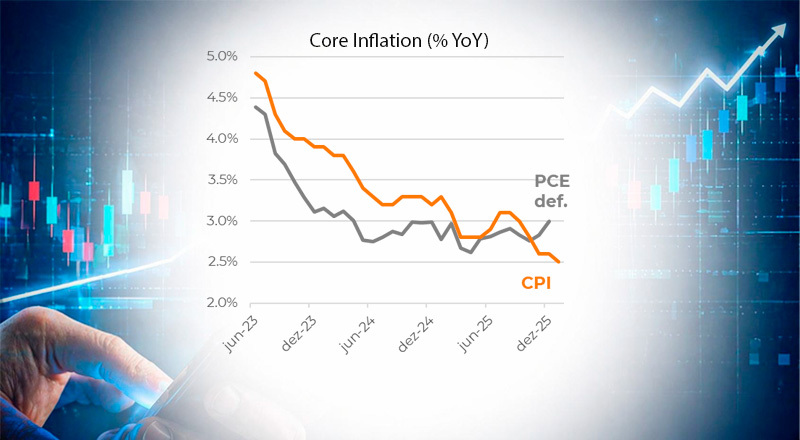
| Recent inflation indicators in the United States have shown diverging trends. The market becomes enthusiastic with the CPI, which is decelerating, but loses confidence when the PCE deflator is released, as it has been trending upward (see Charts 1 and 2). Given that the latter assigns greater weight to the services sector – which is more resilient – and within it, a smaller weight to rent, which has helped pull the CPI downward, we believe the increased caution expressed by members of the Federal Reserve’s Monetary Policy Committee is justified. |
- The CPI has shown a downward trend, with year-over-year variations of 2.4% for the headline index and 3.0% for the core through January, while the personal consumption deflator has shown acceleration, reaching 2.9% headline and 3.0% core, based on data through December 2025.
- The key point is that when the U.S. monetary authority refers to its inflation target, it is referring to the Personal Consumption Expenditures (PCE) deflator. This index measures price changes for all goods and services consumed by households in the United States, regardless of who makes the payment (including businesses and government, as in the case of health insurance), which is not the case with the CPI.
- For this reason, we have observed a more cautious stance among voting members of the Fed. The consensus expectation for 2026 stands at 2.5%, but the actual figure remains around 3% year-over-year. The likelihood of a pause in the rate-cutting cycle is increasing.
The PCE Deflator and the CPI
Inflation dynamics in the United States can be understood through several available indicators. The most widely known is the CPI (Consumer Price Index), equivalent to Brazil’s IPCA. It is published monthly by the Bureau of Labor Statistics (BLS). The CPI measures the evolution of prices paid directly by urban consumers, aiming to capture the cost of living based on a fixed basket of goods and services.
Another closely watched indicator is the PPI (Producer Price Index), also released monthly. It is equivalent to Brazil’s IPA (Wholesale Price Index), calculated by FGV. Unlike the CPI, it measures prices at the producer level, before reaching the final consumer, effectively capturing inflation “at the factory gate.” Movements in the PPI tend to anticipate part of the CPI, particularly for tradable goods such as industrial products and commodities.
The key point, however, is that when the U.S. monetary authority refers to its inflation target, it is referring to the PCE deflator, which is a third indicator. The PCE deflator measures the price variation of all goods and services consumed by households in the United States, regardless of who pays the bill (including businesses and government, such as employer-provided health insurance). Calculated by the Bureau of Economic Analysis (BEA), it uses a chain-weighted methodology, adjusting the consumption basket as consumers substitute between goods. This makes it more sensitive to changes in behavior and generally results in a slightly lower but more stable measure of inflation than the CPI.
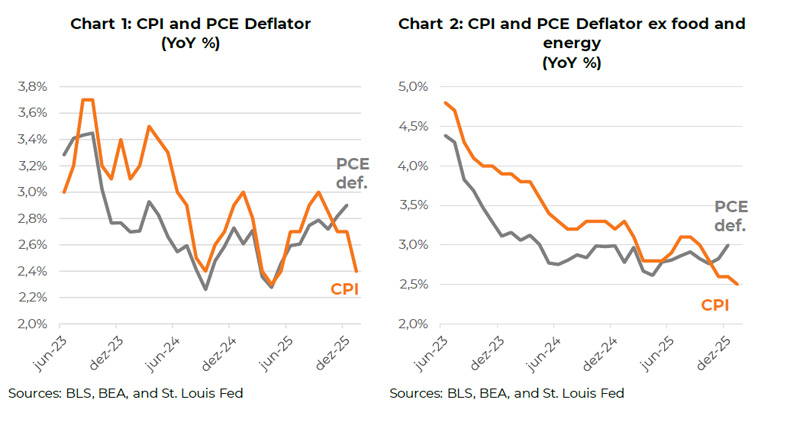
Because of its broader scope and consistency with national accounts, it is the central reference for monetary policy in the United States—especially the core measure, which excludes food and energy. Charts 1 and 2 illustrate the recent dynamics of CPI and the PCE deflator.
In summary: the CPI has been trending downward, with year-over-year changes of 2.4% headline and 3.0% core through January, while the PCE deflator has been accelerating, reaching 2.9% headline and 3.0% core, based on data through December 2025.
Why is the PCE Deflator Rising While the CPI is Falling?
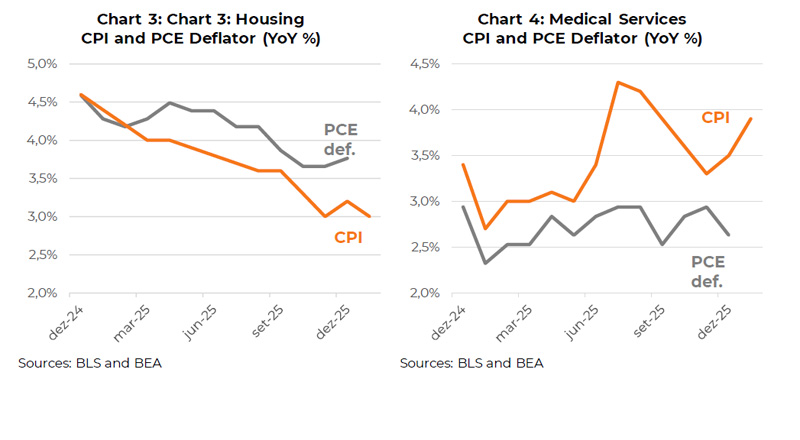
Among several factors that may explain the discrepancy, we highlight the evolution of housing-related costs, particularly rents, which have been rising above average in both indicators, although their weight in the PCE deflator (~15%) is significantly lower than in the CPI (~35%). Since late 2025, the slowdown in rents has begun to appear more clearly in the CPI (see Chart 3 on next page). The expectation is that this component will continue to evolve favorably in upcoming releases, given its significant inertial component.
On the other hand, the PCE assigns a much higher weight to medical services than the CPI (17% vs. 7%), as it includes expenditures made by firms on behalf of consumers (e.g., employer-paid health insurance). If this component remains elevated or accelerates, it tends to push the PCE upward relative to the CPI. As shown in Chart 4 (also on next page), this item has exhibited quite different dynamics across the two indices. So far, this factor has been supportive for the PCE relative to the CPI, but the outlook suggests that this favorable contribution may fade as medical service prices remain more resilient.
From a broader perspective, the PCE deflator is expected to display greater rigidity, as it is the preferred measure for members of the Federal Reserve’s Monetary Policy Committee. This is because the weight of services, typically more persistent due to wage dynamics, is higher (around 70% versus 60% in the CPI). Additionally, rents, which have contributed significantly to CPI disinflation, carry a smaller weight in the PCE deflator.
For these reasons, we have observed a more cautious stance among Fed policymakers. The consensus expectation for 2026 stands at 2.5%, but the actual figure remains close to 3% year-over-year, increasing the likelihood of a pause in the interest rate-cutting cycle.