The slowdown in domestic demand is already under way and tends to deepen in 2027, because the factors that drive it (high indebtedness, restrictive interest rates, a polarized electoral cycle) are unlikely to improve.
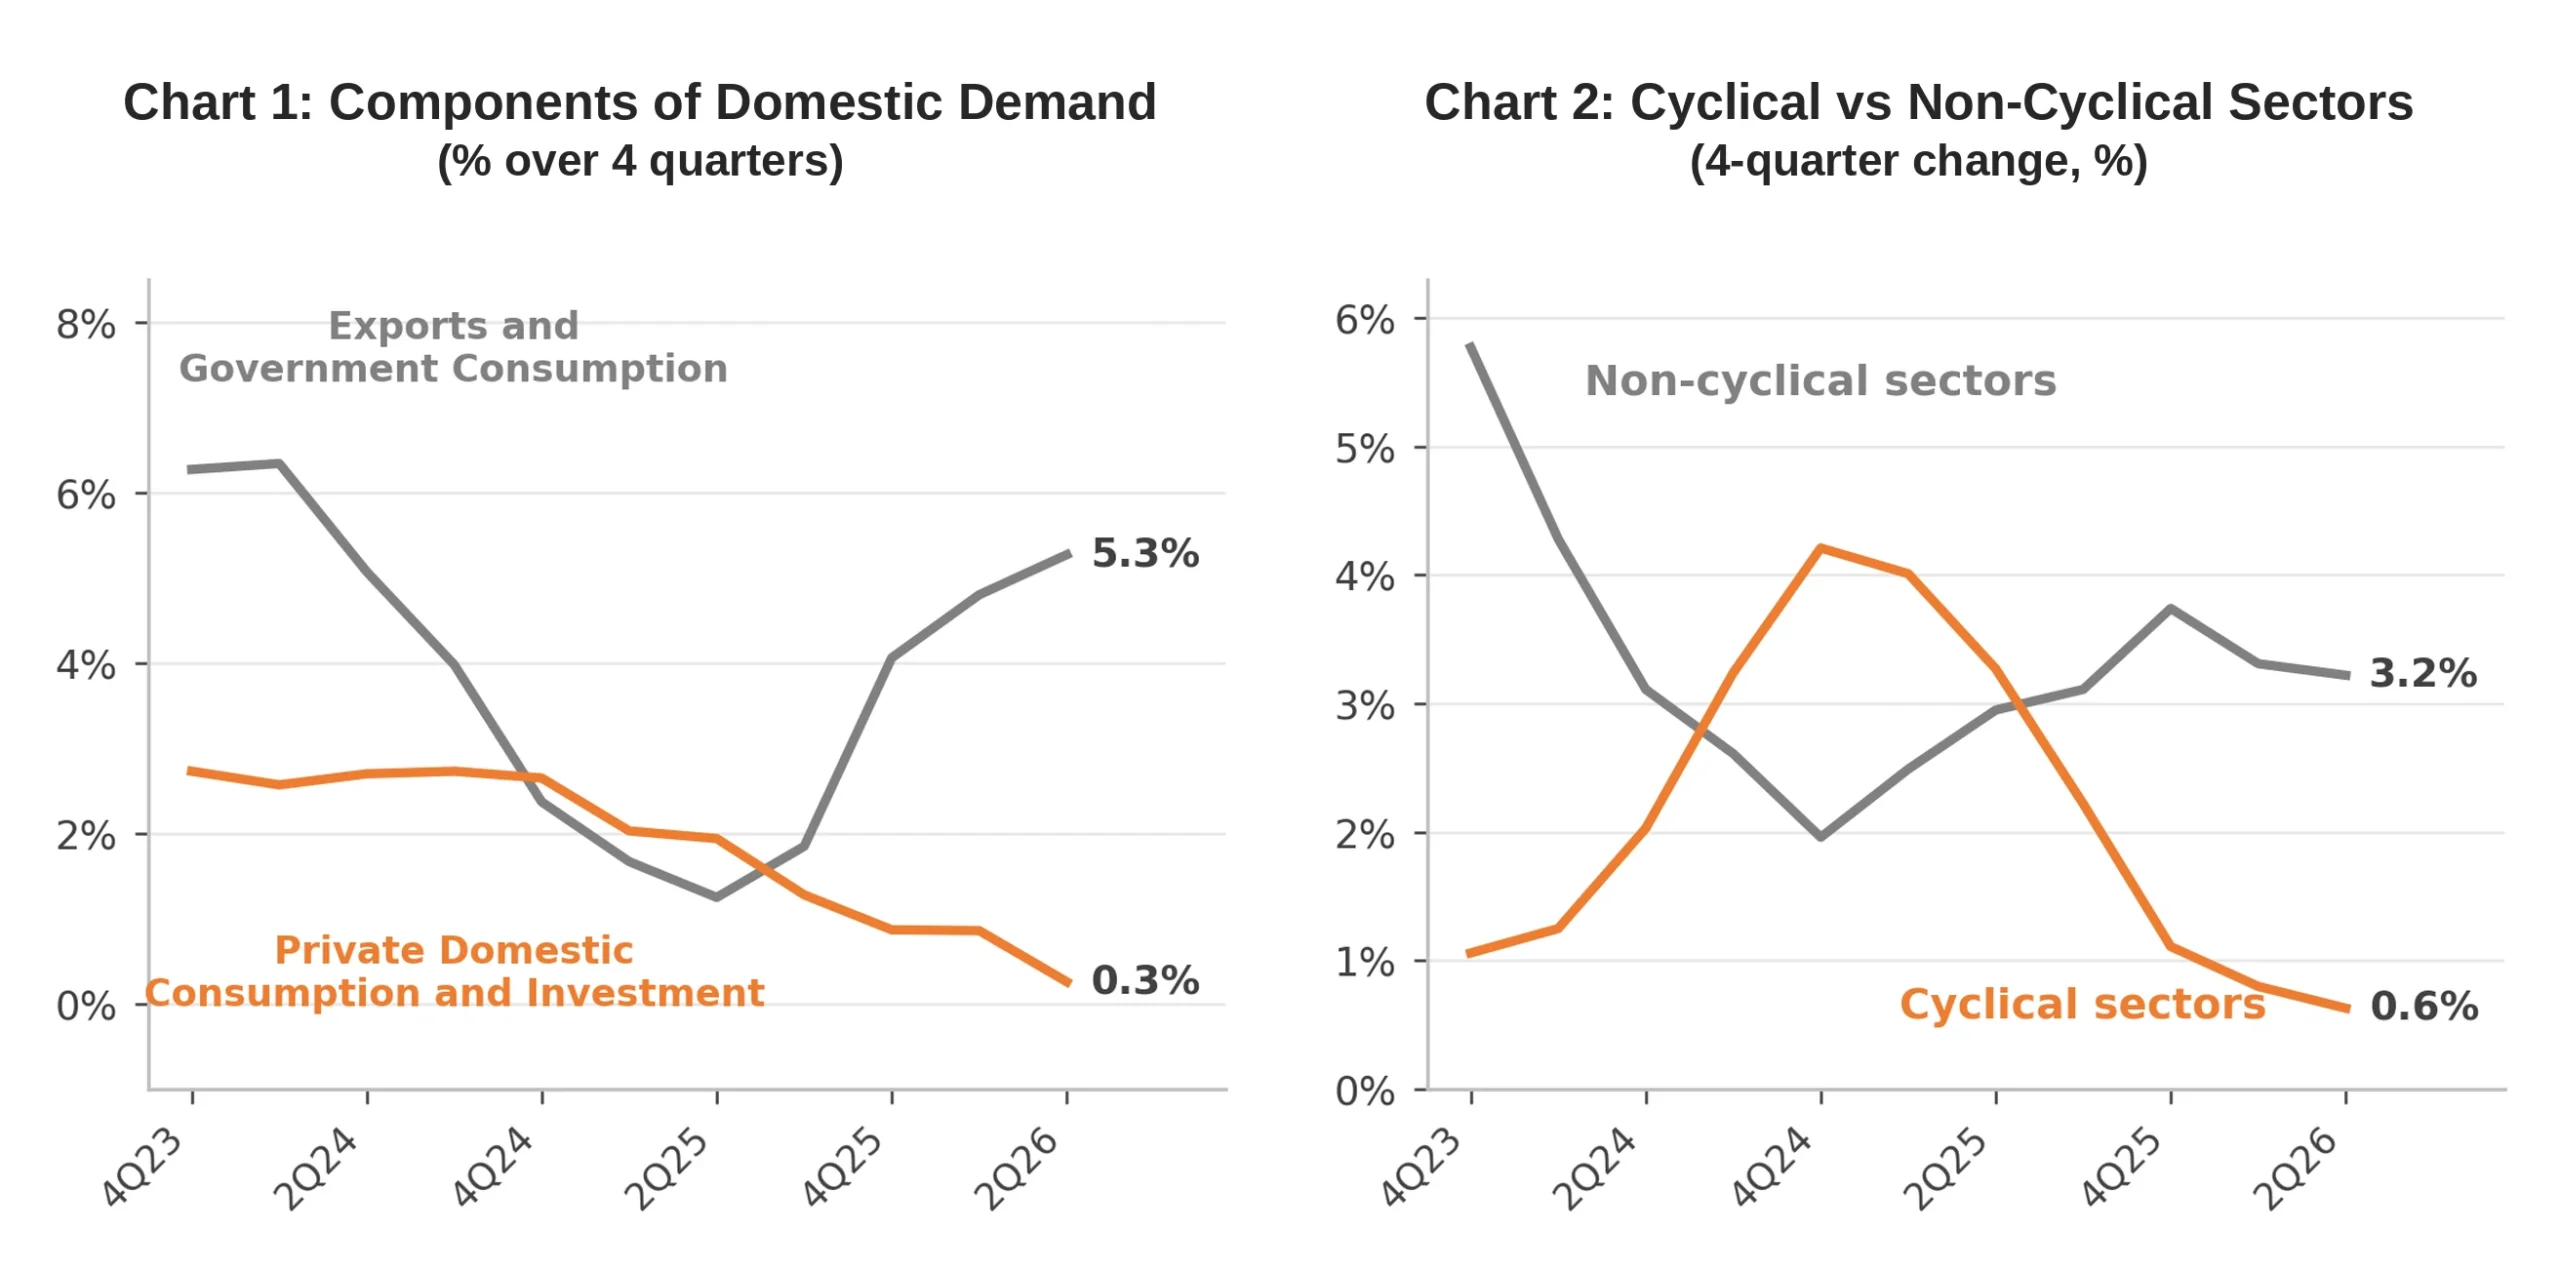
Cyclical sectors: the four-quarter growth of the more cyclical sectors fell from 4.2% in the fourth quarter of 2024 to 0.6% in the second quarter of 2026, while non-cyclical sectors grow 3.2%.
Credit and interest rates: households’ debt-service ratio reached 28.7%, individual default hit 6.0% (a series high) and the ex-ante real interest rate stands at 9.3% per year.
Fiscal and employment: the fiscal adjustment, one way or another, removes the impulse from government consumption, and the labor market is already losing steam: the real wage bill decelerated from 7.3% to 4.8% over twelve months.
Introduction
Growth in 2026 already shows an economy losing momentum, and the loss is concentrated where it matters most for domestic demand: in the cyclical sectors, which respond faster to credit, interest rates and confidence. The slowdown is not greater only because the sectors less sensitive to domestic activity — especially agriculture, mining and exports — continue to sustain the aggregate.
The argument of this report is that 2027 has little reason to bring relief. Household indebtedness is high and default is at a historic peak, which calls for deleveraging. Real interest rates remain in very restrictive territory even with moderate Selic cuts, because inflation is still far from the 3% target. The public sector will have to adjust, and a genuine adjustment reduces government consumption. Finally, employment and income, which have sustained consumption so far, are already losing strength. These are concrete risks, anchored in data that already appear in the charts, and not projections treated as fact.
The Economy Is Already Slowing
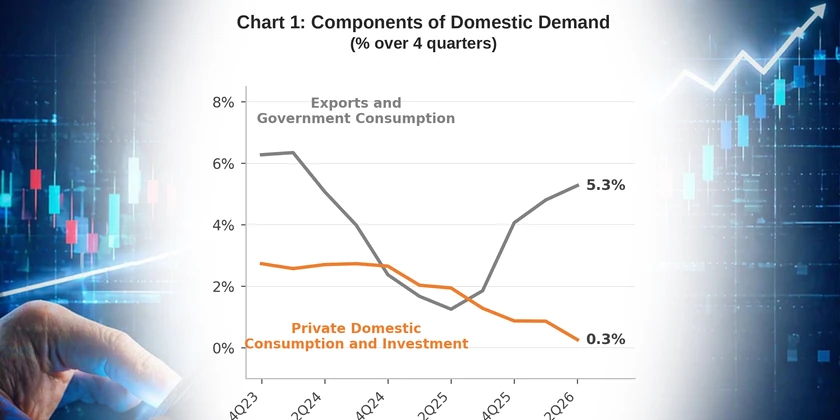
The Quarterly National Accounts data show clear signs of a loss of momentum that is already under way. When the components of demand are separated, the portion most sensitive to domestic activity (household consumption plus investment, minus imports) was growing 2.7% over four quarters at the end of 2023 and now grows only 0.3%. What sustains the aggregate is the less sensitive portion (exports plus government consumption), which accelerated from 1.3% in the second quarter of 2025 to 5.3% (Chart 3).
The same pattern appears on the supply side. We classify as cyclical the sectors whose activity closely tracks the domestic cycle: manufacturing, construction, commerce, transport and other activities. The non-cyclical ones are agriculture, mining, electricity and gas, information and communication, financial and real-estate activities, and public administration. The cyclical sectors were growing 4.2% in the fourth quarter of 2024 and now grow 0.6%; the non-cyclical ones, which include public administration, went from 2.0% to 3.2%, with a peak of 3.7% in the fourth quarter of 2025 (Chart 4).
The reason cyclical sectors slow first and more sharply is that they are more sensitive to monetary policy, credit and the confidence of consumers and firms. When interest rates are high and credit becomes more expensive, purchases of durable goods, investment and construction are postponed. Non-cyclical sectors, by contrast, depend more on the harvest, international growth, contracts and public administration.
For 2027 it seems clear that the determinants of cyclical-sector performance are unlikely to improve. Indebtedness is high, interest rates remain elevated and the polarized electoral cycle keeps consumers and businesses on hold. Added to this is the risk that government consumption, which is still growing today, turns negative. For this reason, what is a slowdown today may become a contraction next year.
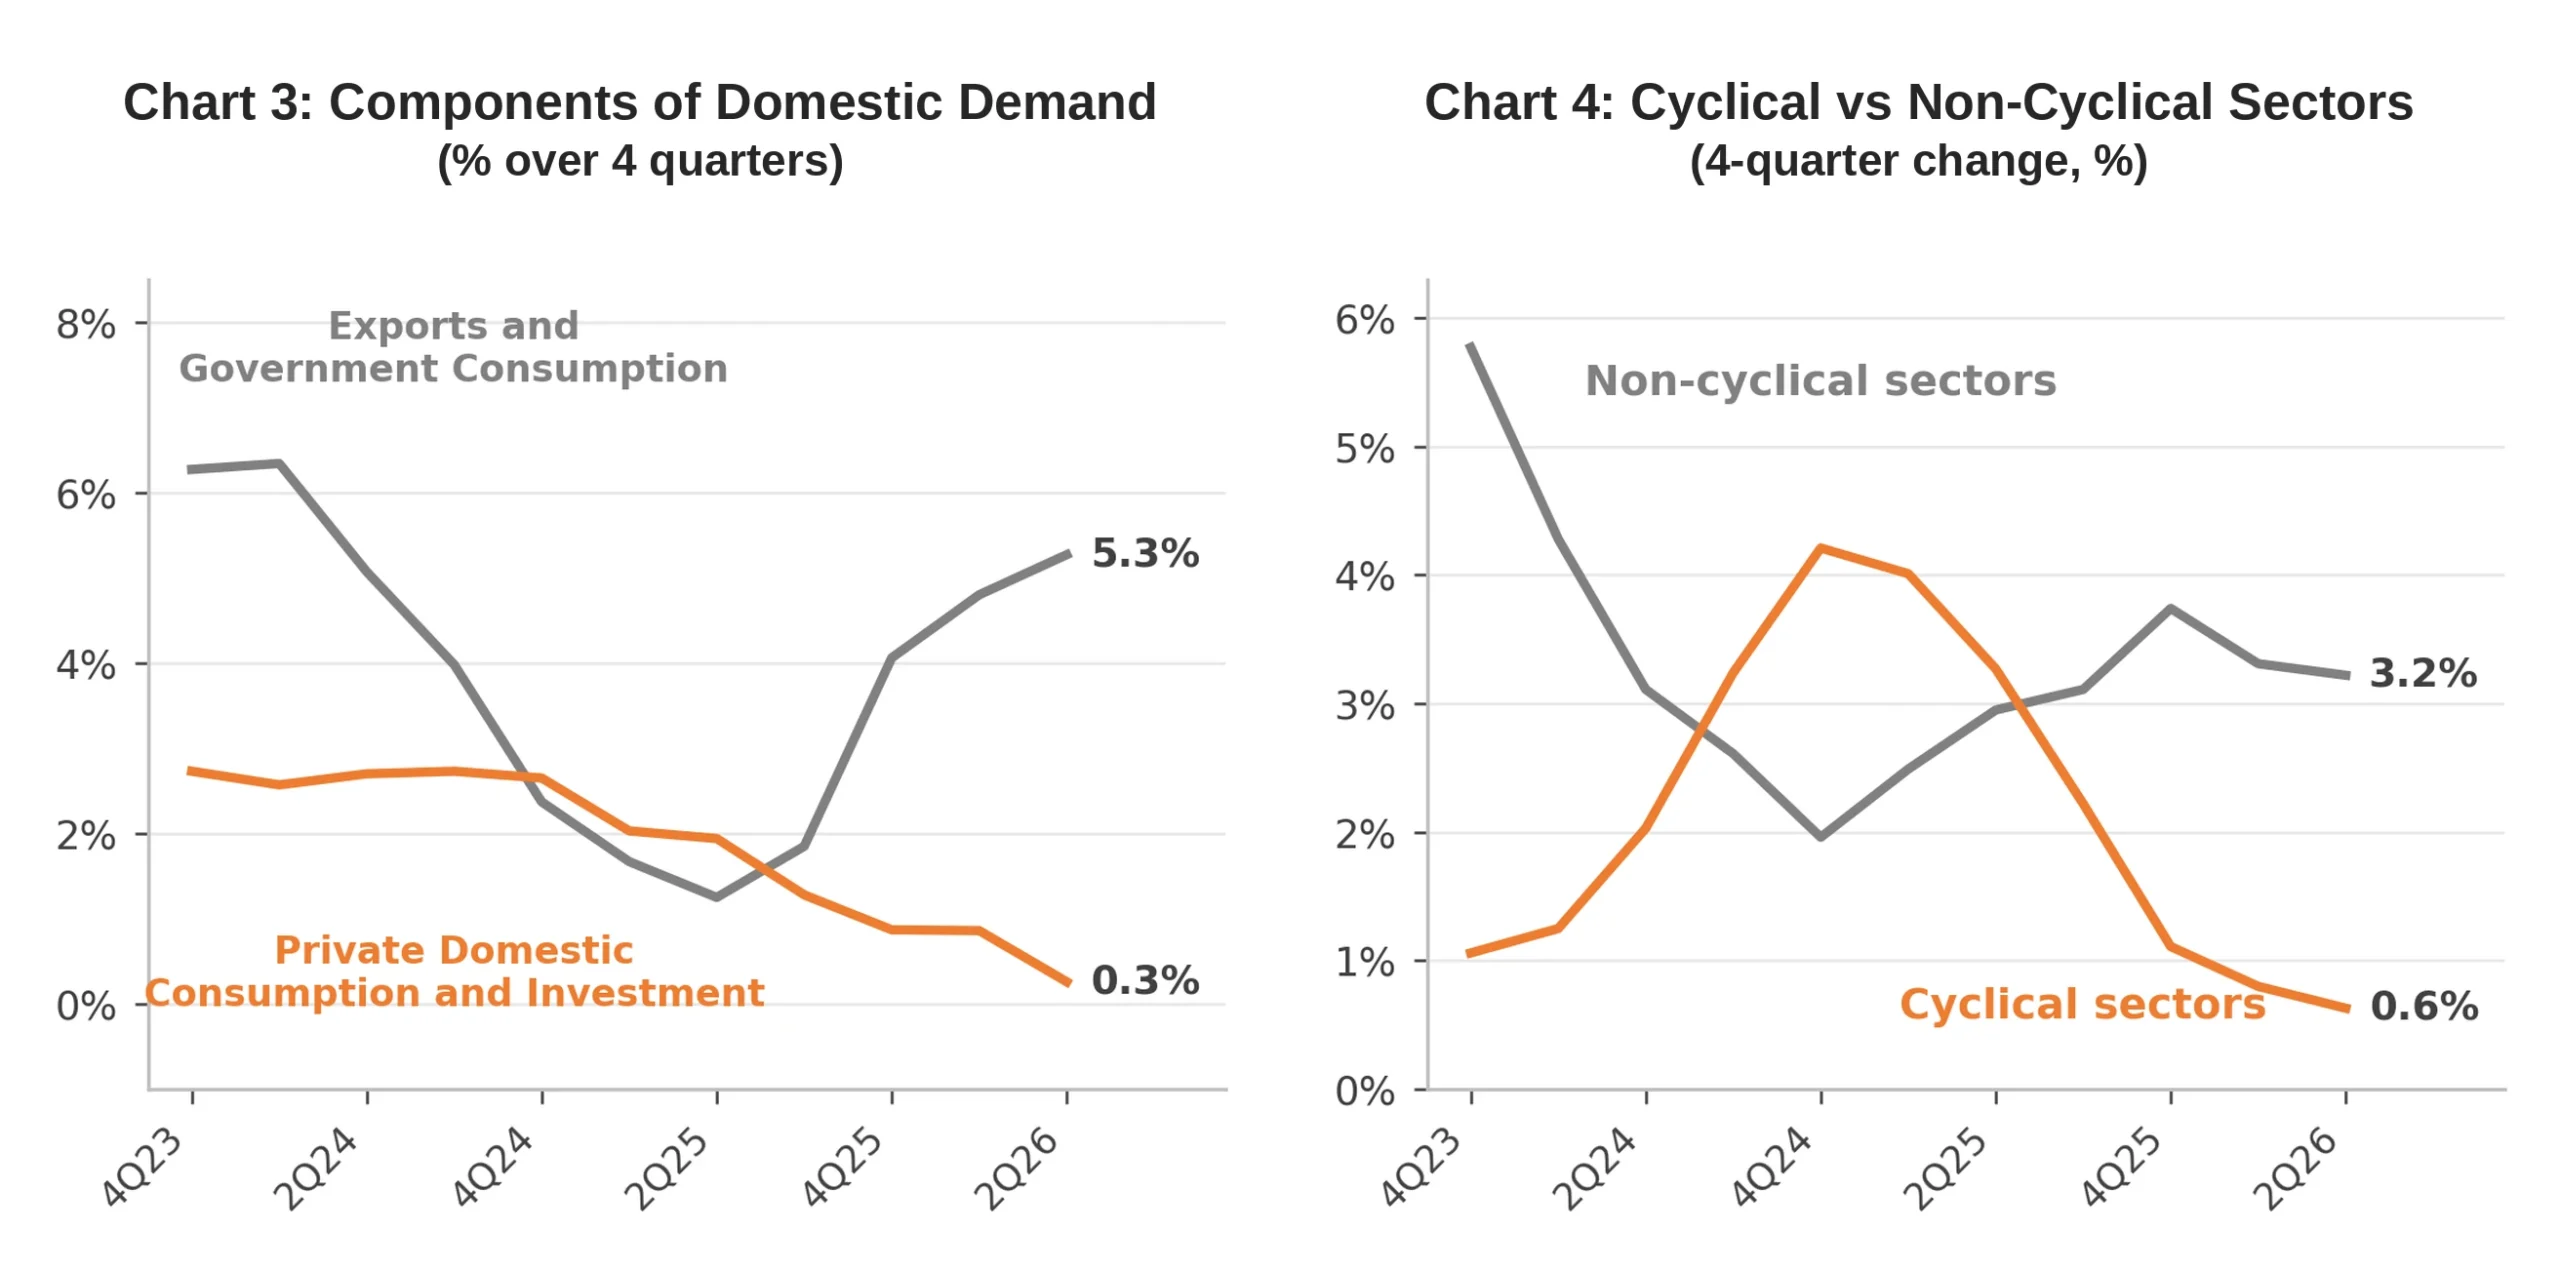
Definitions: sensitive to domestic activity = household consumption + GFCF − imports; less sensitive = exports + government consumption (each component weighted by its respective share and divided by the sum of the weights). Cyclical = manufacturing, construction, commerce, transport and other activities; non-cyclical = agriculture, mining, electricity and gas, information and communication, financial, real-estate and public administration. Rolling weighting: sum of the last four quarters at current values of each subsector over the total of the listed subsectors.
Chapter 2: Credit and Interest Rates – It Will Get Worse
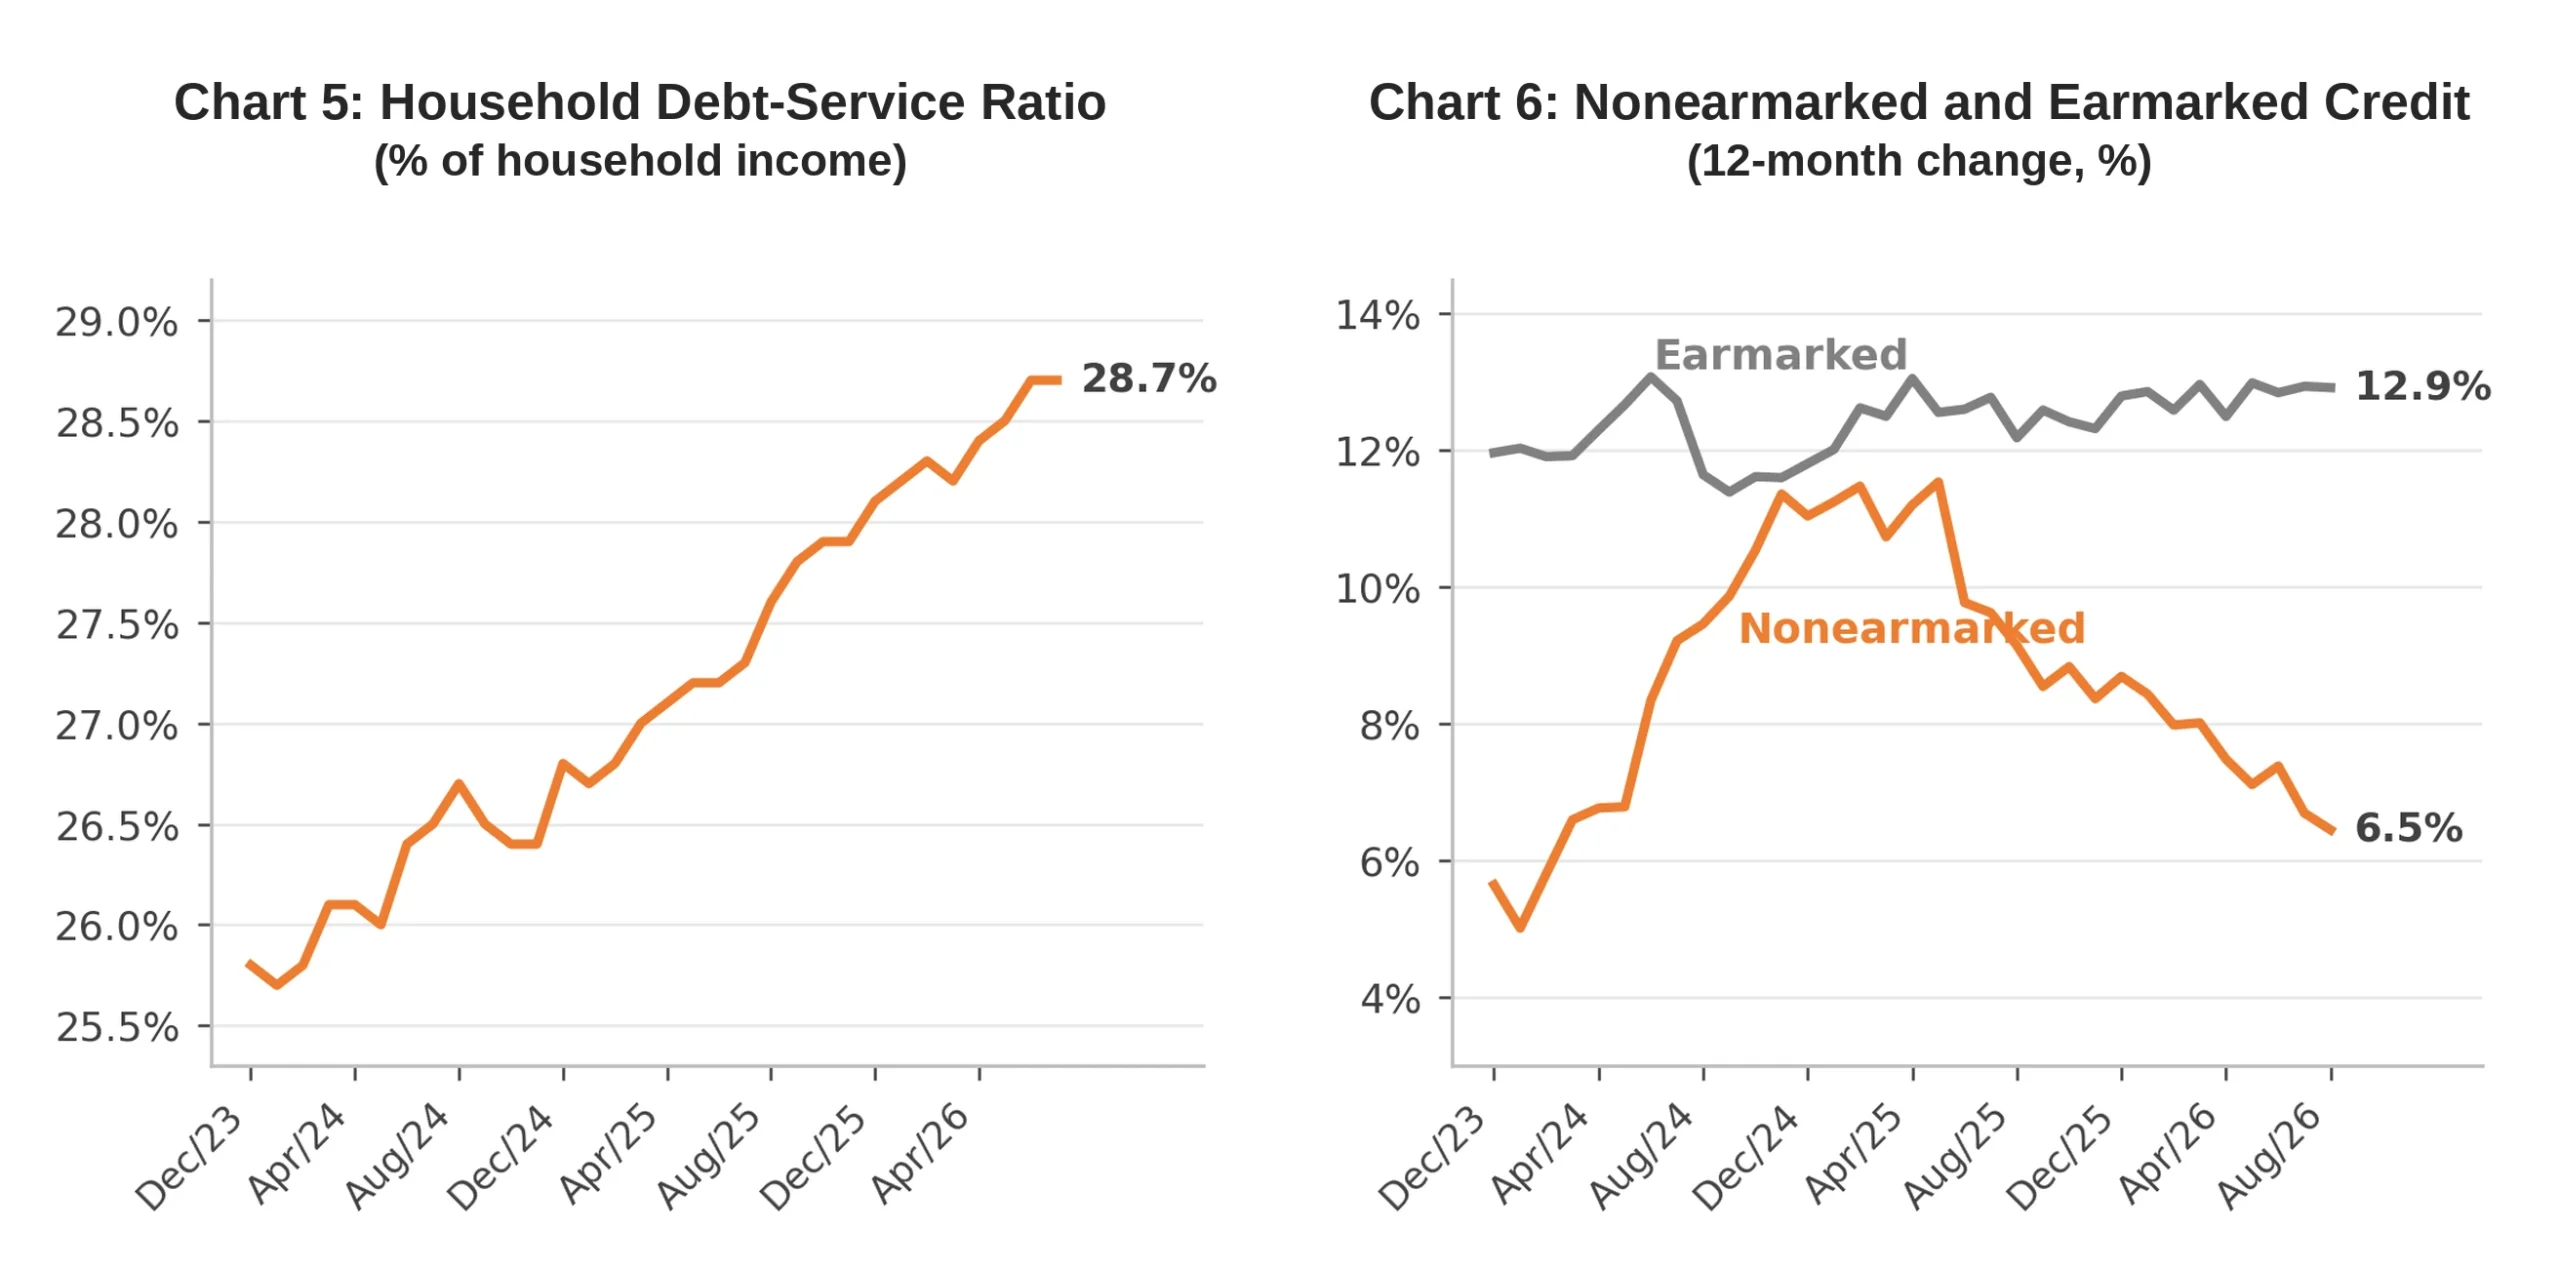
Households are already heavily indebted. With the financial system alone, total liabilities stand at around 49.9% of income accumulated over twelve months. The debt-service ratio rose from 25.8% in December 2023 to 28.7% in July 2026 (Chart 5). There is no balance-sheet room to sustain a new round of financed consumption.
Nonearmarked credit, which is most closely tied to consumption and working capital, is already decelerating clearly: twelve-month growth, which had accelerated from 5.6% in December 2023 to a peak of 11.5% in the first half of 2025, fell to 6.5% in August 2026. Earmarked credit continues to grow near 12.9%, but it depends on policy decisions and subsidized resources (Chart 6). After the election, earmarked credit tends to fall faster, removing a cushion precisely when nonearmarked credit is already losing strength.
There is also an asymmetry. With high interest rates and a rising debt-service ratio, credit supply becomes more selective, and the average cost rises for the borrower who needs it most. The result is a familiar circle: less credit, less consumption, less revenue for firms and more pressure on those who are indebted.
The central point is that the economy urgently needs a deleveraging process. The proof is in individual default, which reached 6.0% of the portfolio in August 2026, the highest reading in the Banco Central’s series, which began in 2011, against 5.6% in May. When default is at a historic high, banks restrict lending and households cut spending to pay down debt. This deleveraging is in itself contractionary for domestic demand, and it is still in its early stages.
Interest Rates Will Stay in Restrictive Territory
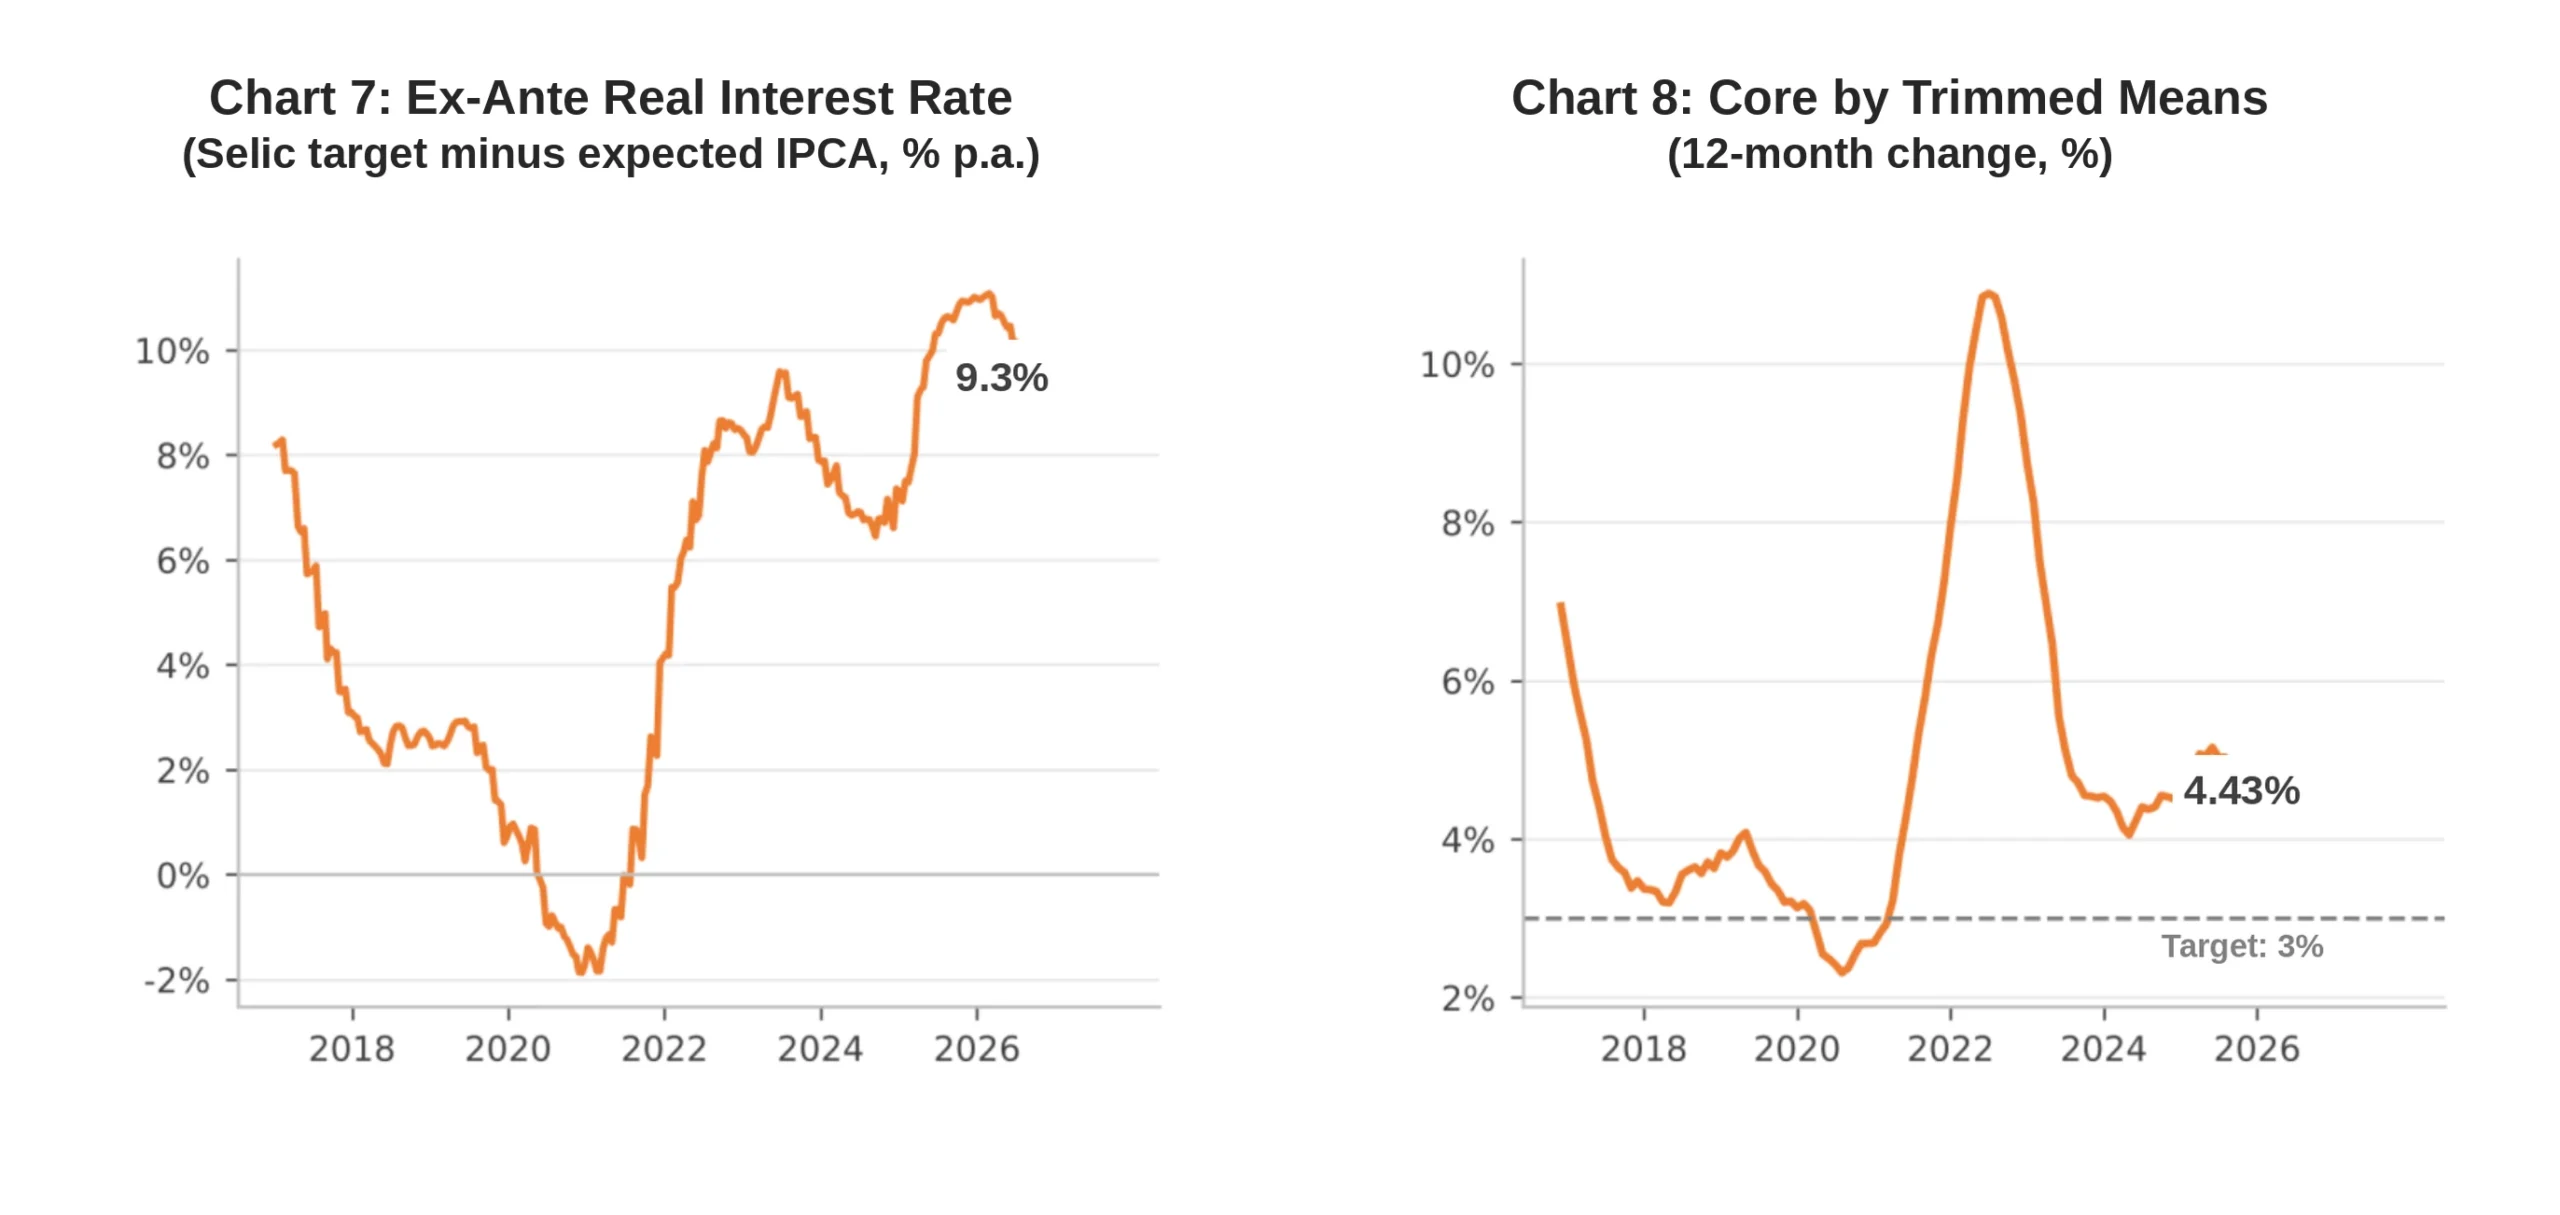
Everyone knows monetary policy is quite tight. The economy is not in recession only because of recurring fiscal expansion. The ex-ante real interest rate, calculated as the Selic target minus inflation expectations for the next twelve months, stands at 9.3%, over the last 20 years only below the 11.1% reached at the start of this year (Chart 7). This means that moderate Selic cuts tend to keep interest rates in restrictive territory for a long time.
Inflation is, and should remain for a long time, far from the 3% target. Trimmed-means core inflation accumulates 4.4% over twelve months (Chart 8), and the Focus median of October 9 for 2027 IPCA is 4.3%, more than a percentage point above the target. For 2028, the market consensus is still 3.8%. The Banco Central has no room to cut quickly with inflation and expectations at these levels.
For the real interest rate to fall, the Selic would have to decline faster than inflation expectations. That is unlikely: aggressive cuts would require anchored expectations, which is not the case, and this would raise the risk of a worsening in expectations, in the exchange rate and in the risk premium, which would force the Banco Central to backtrack.
Comparing today’s real interest rate with what Focus implies for the coming years: at the end of 2026, an expected Selic (13.25%) against a one-year-ahead IPCA projected at 4.3% results in 9%; for the end of 2027, a Selic of 12.00% minus an expected IPCA of 3.8% still results in 8.2%. The real interest rate would fall only slightly and would remain very restrictive through 2028.
Much Smaller Fiscal Expansion (Perhaps Even Contraction)
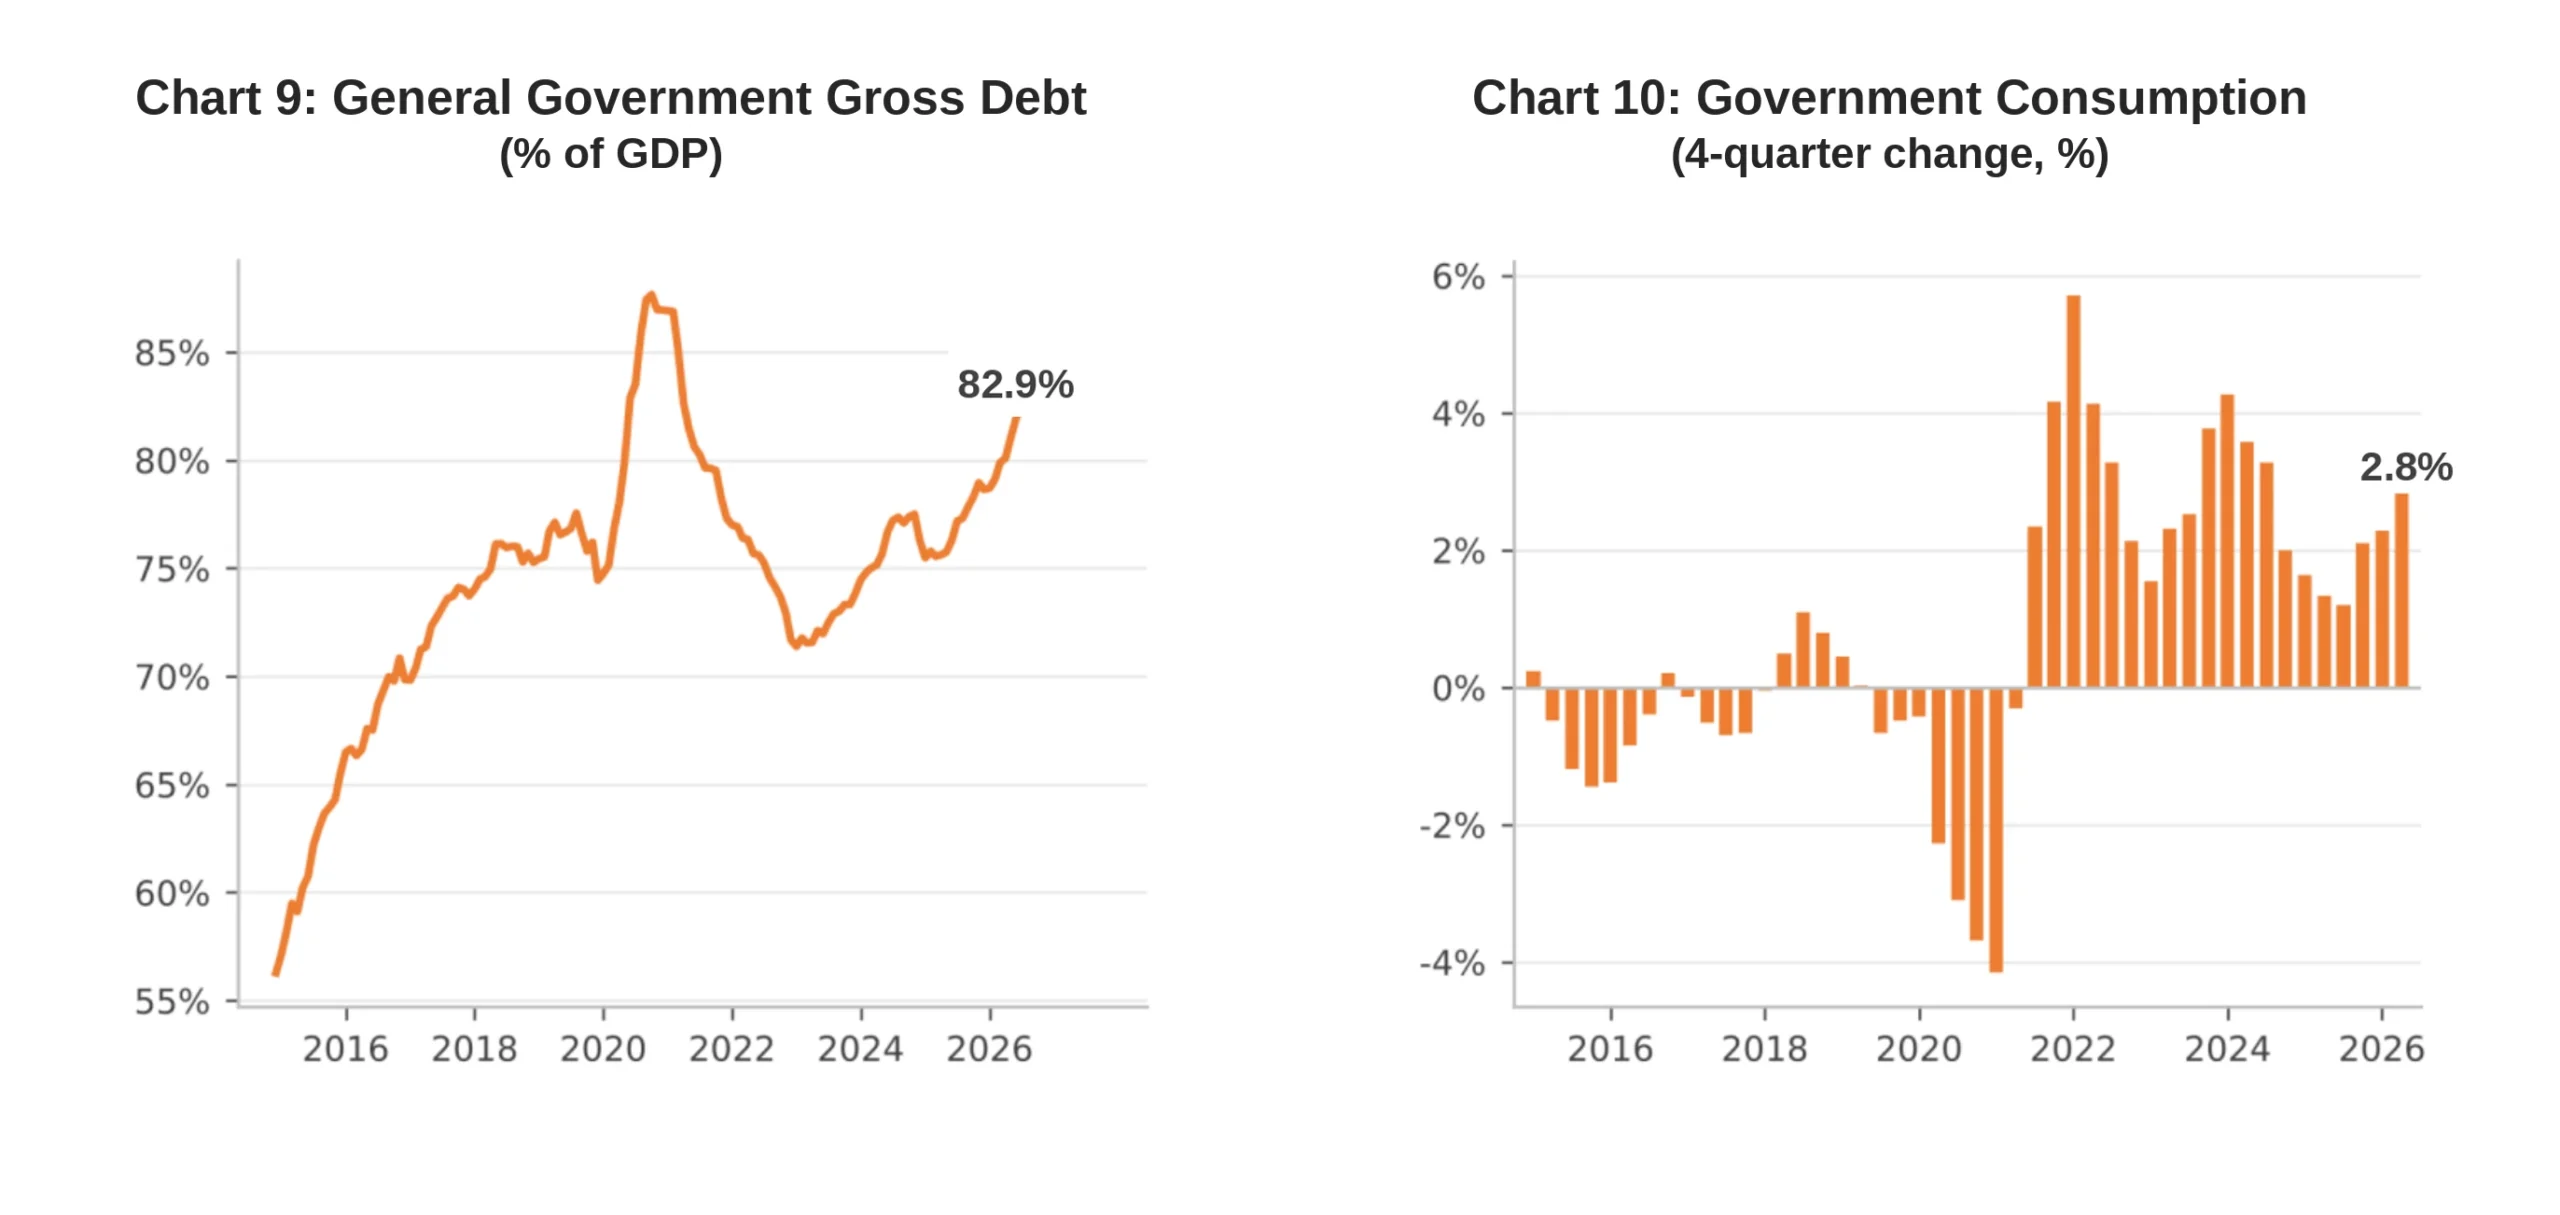
The public sector will have to adjust. General government gross debt went from 56.3% of GDP in December 2014 to 82.9% in August 2026 (Chart 9), on an upward trajectory in an environment of very high real interest rates. This dynamic cannot be sustained indefinitely.
The adjustment will come one way or another. The hard way, if the market begins to question long-term sustainability and reduces financing to the Treasury: the exchange rate would suffer a shock, inflation would rise, interest-rate cuts would become unfeasible and the fiscal crisis would worsen, in a cycle that feeds back the loss of confidence.
Even the “good” adjustment would mean raising taxes, which depends on Congress and is uncertain in a polarized electoral environment, and containing spending growth. Government consumption, which grows 2.8% over four quarters in the second quarter of 2026 (Chart 10), will certainly lose ground.
The consequence is a much smaller fiscal impulse in 2027, with the possibility of contraction. In a year when credit, interest rates and employment already constrain private demand, the loss of support from government consumption removes the last cushion and reinforces the case for much weaker domestic demand.
Employment and Income Will Stop Helping
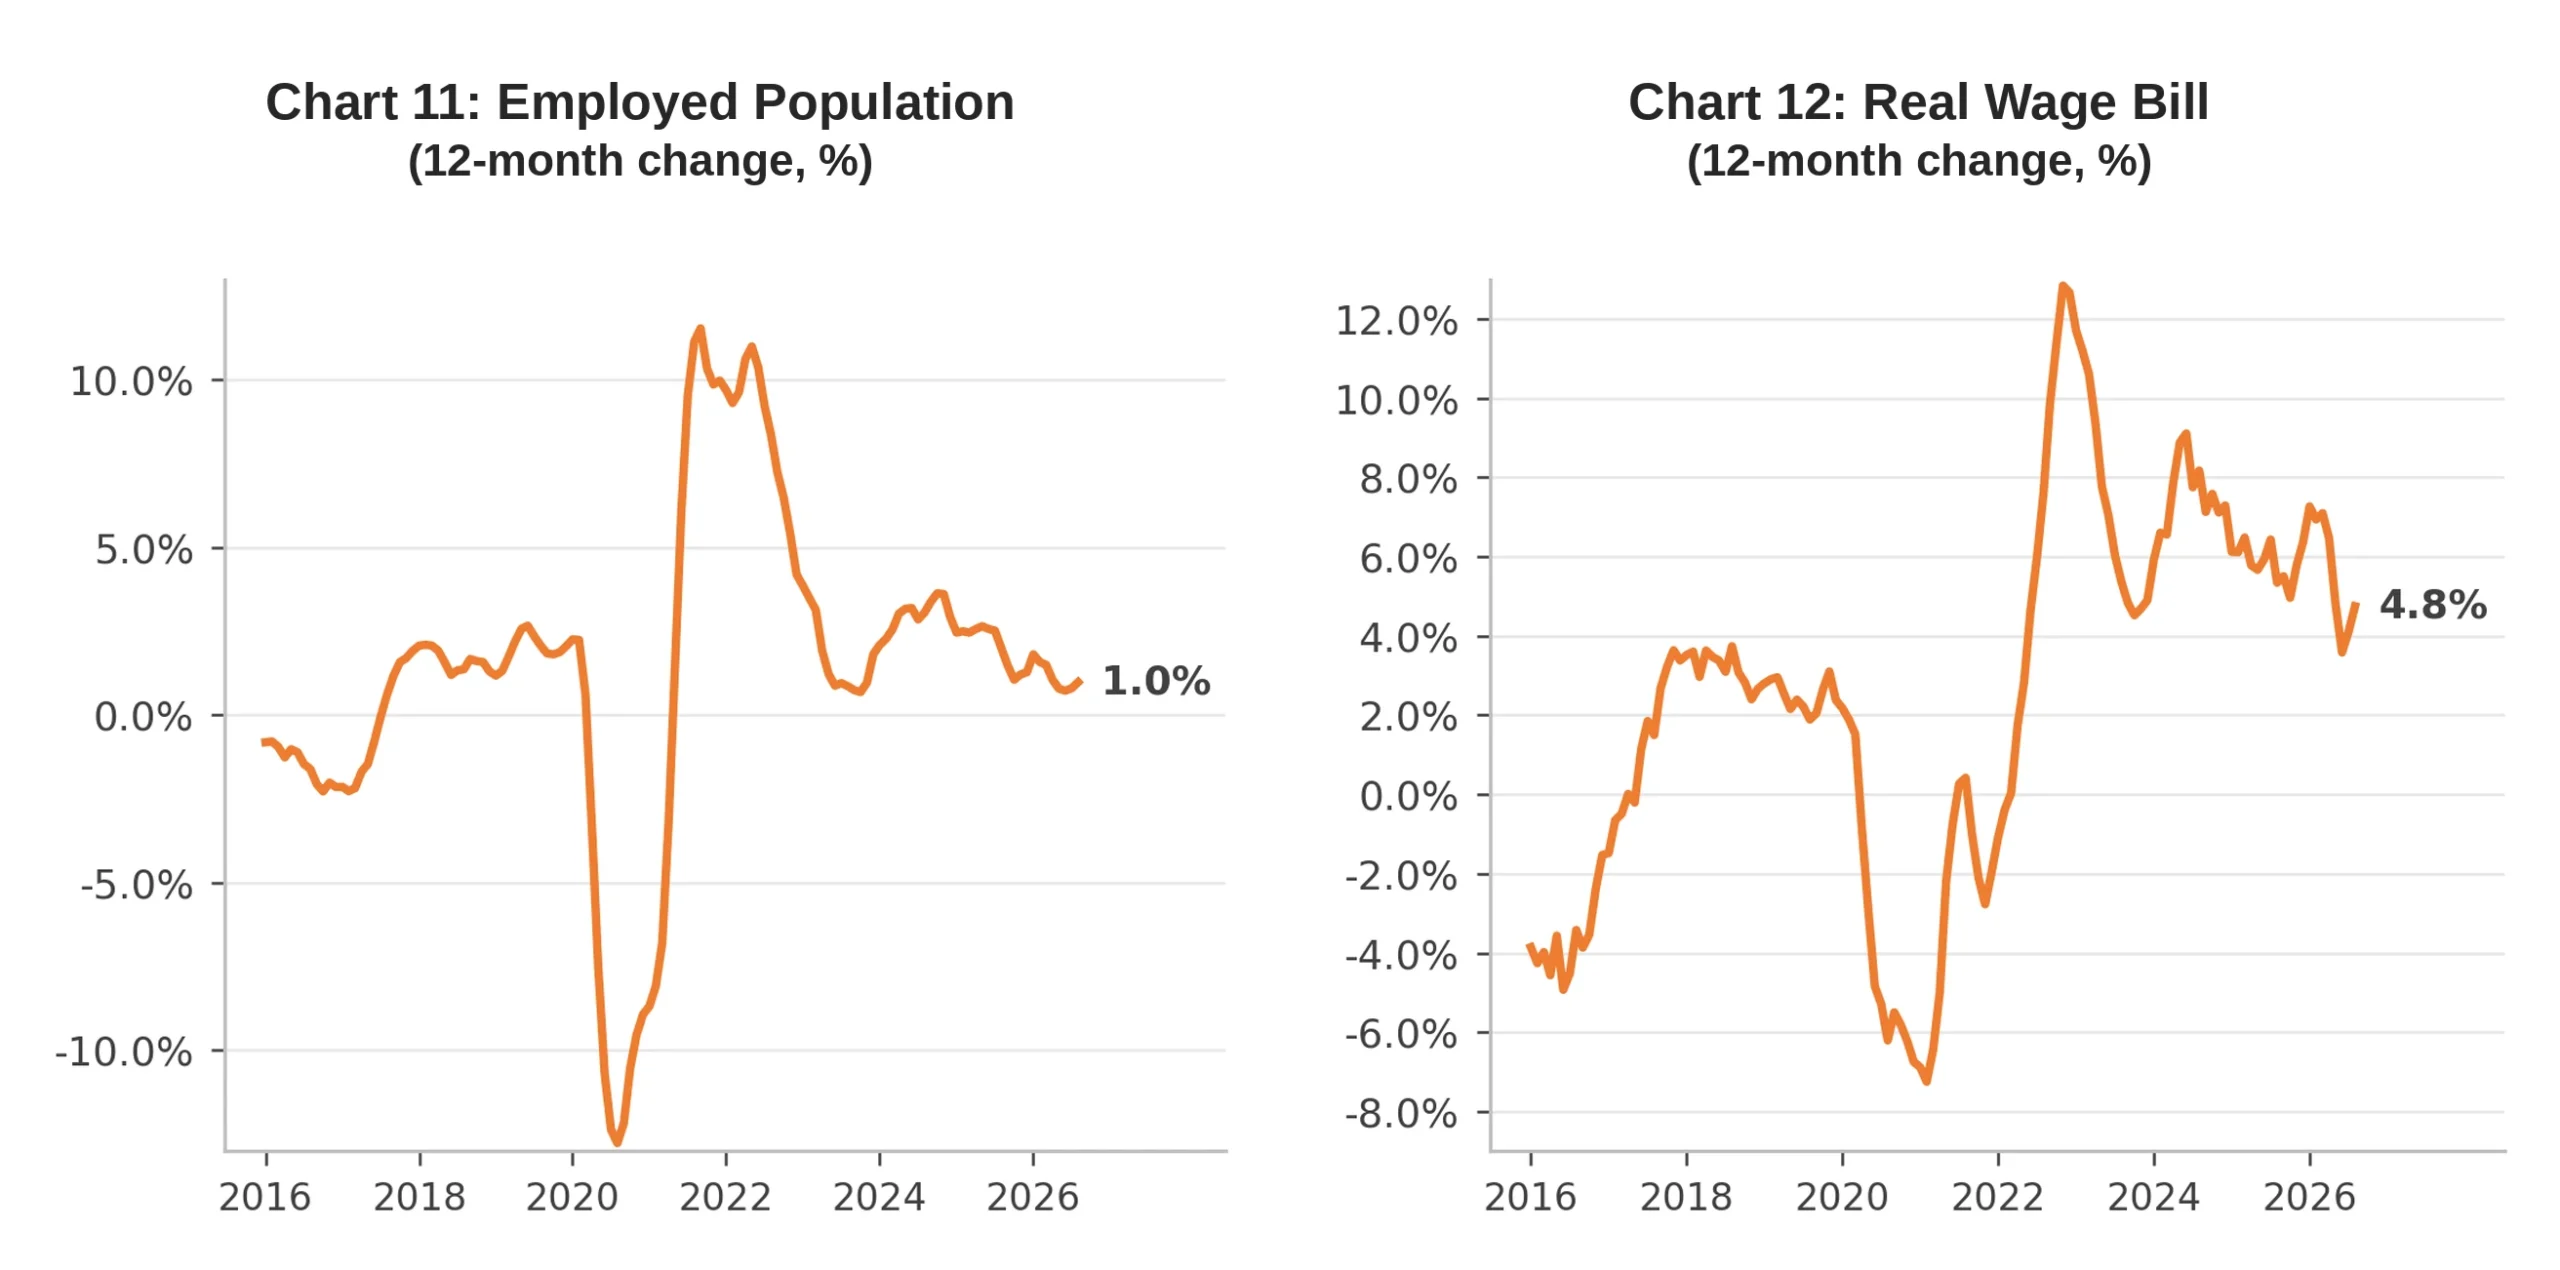
The data show the labor market has already been losing strength. Employment grows 1.0% over twelve months in August 2026, against 1.8% at the start of the year (Chart 11), and the real (deflated) wage bill decelerated from 7.3% to 4.8% over twelve months (Chart 12).
The loss of strength tends to intensify. The cyclical sectors, which are the largest employers in commerce, construction and services, weaken more sharply, and the lag between activity and employment suggests the adjustment is not yet complete. Income tends to follow the same path.
There is an additional risk: a weaker labor market raises default, which is already at a historic high. More default restricts lending and reduces consumption, which can trigger a credit crisis, with a feedback loop among employment, income, default and the supply of financing.
Nor should we expect the government to cushion the loss of employment, for the reason in the previous chapter: the public sector will have to adjust, and spending expansion will not be available to prop up demand. What remains for next year is a less dynamic labor market, without the support that helped in previous cycles.